AI agent for managing directors
Innovation Portfolio Metrics Agent
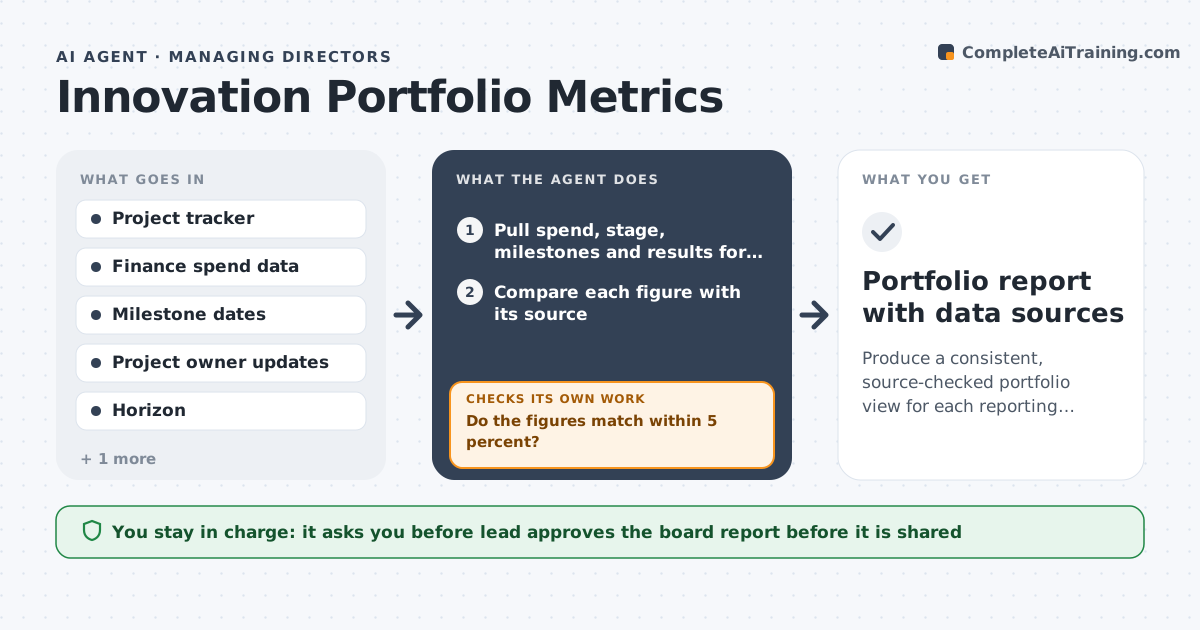
Produce a consistent, source-checked portfolio view for each reporting cycle
What it does
Before each board meeting, the innovation lead spends days collecting numbers that disagree between finance, project trackers and slides. This agent pulls spend, stage, milestones and results for every project. It checks each figure against its source, such as the finance system and the project tracker, and flags differences and gaps like a missing milestone date. It asks project owners for missing data and rechecks. It then builds the portfolio view with balance by horizon (core, adjacent, new) and by risk, and calculates stage progress and conversion. It writes a short note on what changed since last quarter. The lead approves the board report. Edge case: when two sources differ, it shows both and uses the finance figure as the default.
How it works
Follow the arrows from top to bottom. The orange dashed arrow is the loop: when a check fails, the agent goes back and tries again.
Read the steps as a list
- Reporting cycle begins
- Pull spend, stage, milestones and results for every project
- Compare each figure with its source
- Do the figures match within 5 percent?If not: Ask the project owner to explain or correct, then pull again. Back to step 2.
- Is every project's data complete?If not: List the gaps and request them from owners. Back to step 2.
- Build the portfolio view by horizon, stage and risk
- Compare with last quarter and write the change note
- Lead approves the board reportThe agent waits here for your OK.
- Portfolio report with data sources
How it decides
It trusts finance for spend and the tracker for stage, flags any difference above 5 percent and requires owner explanation.
- Use finance figures as the default for spend
- Flag differences above 5 percent
- Require stage and next milestone for every project
- Show balance by horizon against the target mix
Make it yours
Every agent is a starting point. You choose these settings for your own situation.
- Difference tolerance (default 5 percent)
- Horizon target mix (default 50 core, 30 adjacent, 20 new)
- Report frequency (default monthly)
- Metrics shown (default spend, stage, milestones, risk)
What keeps you in control
It always asks you first
- Lead approves the board report before it is shared
Hard limits
- Never publish a report without approval
- Never change source data
- Show the source for each figure
It stops when
- Done: Report approved and distributed by the lead
- Stop: Source systems are unavailable, so hand to the lead
Set it up
We guide you through the set-up, step by step
Members get the full set-up guide for this agent. No technical skills needed: you copy, paste and upload.
- One set of instructions to paste into your AI, with the clicks for ChatGPT, Claude, Microsoft 365 Copilot, Gemini and Grok
- The agent then walks you through connecting your own data, one source at a time
- A downloadable copy with the flow chart, the rules and the full guide