AI app for it and development · no coding needed
Evidence-backed data visualization and sharing workspace
Reduce tool sprawl while keeping one traceable path from raw data to a shared, reviewed visualization.
Made for: Data and analytics teams in mid-sized companies who build and share dashboards
What it does for you
The problem
Teams rent several separate tools to prepare data, build charts, and share results, so work and access rules are scattered across subscriptions.
What it gives you
Approved interactive visualization linked to its evidence
What you give it
Connected data sourcesquery logictransformation stepsteam permissions
Build your own version of Hex, Rose.ai and more
One app with what these 3 AI tools do, yours to keep and change: Hex, Rose.ai, ToDiagram.
Everything these tools do, in one app
- Data visualization Creates charts, diagrams, or other visual representations from data.Found in Hex, Rose.ai, ToDiagram
- Data transformation Cleans, restructures, or prepares data for analysis.Found in Hex, Rose.ai, ToDiagram
- Collaboration and sharing Lets teams work together on data projects and share results.Found in Hex, Rose.ai, ToDiagram
- Data source connectivity Connects to external databases, warehouses, or files to access data.Found in Hex, Rose.ai
- AI-powered assistance Uses AI to help with queries, data filtering, restructuring, or translation.Found in Hex, Rose.ai, ToDiagram
- Natural language queries Allows users to search and analyze data using conversational language.Found in Rose.ai
- Interactive query editor Provides an environment for writing and editing data queries.Found in Hex
- Multi-format support Converts data from formats like JSON, YAML, CSV, and XML into diagrams.Found in ToDiagram
- Interactive diagrams Enables real-time editing, navigation, and debugging of visual data structures.Found in ToDiagram
- Version control Tracks changes to data projects over time.Found in Hex
- Permission settings Controls access to data and projects for secure sharing.Found in Hex, Rose.ai
- Real-time notifications Alerts team members about updates or changes.Found in Hex
- UI components library Offers reusable interface elements and knowledge resources.Found in Hex
- Logic trees Provides traceable logic trails behind data insights.Found in Rose.ai
- Data marketplace Allows users to explore, purchase, or sell datasets.Found in Rose.ai
- Chrome extension Integrates with the browser for quick data conversion and editing.Found in ToDiagram
- Cloud storage Saves and shares diagrams online for easy access.Found in ToDiagram
- Search and filter Locates and highlights specific nodes within diagrams.Found in ToDiagram
How it works, step by step
- Connect to external databases, warehouses and files
- Clean and restructure data for analysis
- Write and edit queries in an interactive editor
- Accept natural language questions and translate them into queries
- Convert JSON, YAML, CSV and XML into diagrams
- Generate charts and diagrams from prepared data
- Edit, navigate and debug visual structures in real time
- Search and filter nodes within diagrams
- Track project changes over time
- Set permissions for data and projects
- Notify team members about updates
- Reuse interface components and knowledge resources
- Show traceable logic trails behind each insight
- List datasets for exploration or exchange
- Convert and edit data from the browser
- Save and share diagrams in cloud storage
- Compare the reviewed result with the recorded baseline and value assumptions
- Capture corrections and named-owner approval before consequential use
- Export a versioned approved interactive visualization linked to its evidence with source references and unresolved questions
Jobs this app suits
Our AI checked this app against 500 jobs; these get the most out of it. Each job links to its learning path.
Build it yourself with your AI system
Build this app yourself, no coding needed
Start with a quick version you can try in a few minutes. Like it? Then build the full app by copying and pasting our step-by-step instructions: everything is prepared for you.
Sign in to see how to build it yourself
Build a quick version to try, or get the full app pack for Evidence-backed data visualization and sharing workspace with the step-by-step building instructions. You don't need any technical skills: you copy, paste and answer a few questions. Both are included in the membership.
4 Have it built for you days to a few weeks
Rather not do it yourself, or want it fully tailored to your data, your way of working and your brand? Nexibeo builds Evidence-backed data visualization and sharing workspace with you.
What's in the app pack
Included in the Complete AI Training membership.
- The building instructions your AI follows, step by step
- The questions your AI will ask you about your business before it starts
- A clickable demo you can open in your browser, to see how it should work
- A detailed blueprint of the screens, the information it keeps and the checks it runs
Become a member to get the app packAlready a member? Sign in
The files, for the technically curious
- START-HERE.mdHow to build it with your own AI (read first)3 KB
- README.mdOverview and links3 KB
- questions.mdQuestions to answer before you build2 KB
- prompt-cloudflare.mdThe full build prompt, hosted on Cloudflare25 KB
- prompt-vps.mdThe same build on your own server (Docker)25 KB
- spec.jsonData model, API, AI pipeline, acceptance criteria12 KB
- demo/index.htmlThe working demo on sample data200 KB
Questions
Do I need to know how to code?
No. You copy and paste the prompts on this page into ChatGPT or Claude, and the AI does the building. When it asks you something, you answer in your own words.
What does it cost?
The quick version, the app pack and the step-by-step instructions are for members: you pay the membership price, not a price per app (see the plans). Building the full app uses your own ChatGPT or Claude subscription. Putting it online is often cheap or no cost at the start, and your AI tells you before anything costs money.
How long does it take?
The quick version: about two minutes. The real app: an afternoon for a first version you can use, longer if you want every feature.
Can I change it to fit my business?
Yes. Tell your AI what to change in plain words, like “add a column for the price” or “use our logo and colours”. Or have Nexibeo build and customise it for you.
More detailsHow the AI works, safeguards and what to build first
Reduce tool sprawl while keeping one traceable path from raw data to a shared, reviewed visualization. For data and analytics teams in mid-sized companies who build and share dashboards, convert connected data sources, query logic, transformation steps and team permissions into an approved interactive visualization linked to its evidence. The benefit is a testable hypothesis, measured through accepted shared visualizations per analyst hour and corrections after publication; do not assume that AI output alone produces business value.
Confirm the buyer's problem and scope, collect connected data sources, query logic, transformation steps and team permissions, then follow this sequence: 1. Connect to external databases, warehouses and files. 2. Clean and restructure data for analysis. 3. Write and edit queries in an interactive editor. 4. Accept natural language questions and translate them into queries. 5. Convert JSON, YAML, CSV and XML into diagrams. 6. Generate charts and diagrams from prepared data. 7. Edit, navigate and debug visual structures in real time. 8. Search and filter nodes within diagrams. Resolve uncertain cases with qualified reviewers, approve approved interactive visualization linked to its evidence, and measure accepted shared visualizations per analyst hour and corrections after publication against a documented baseline.
How the AI works
Use AI to interpret permitted inputs, suggest structured mappings and generate candidate outputs for the three stated task modules. Use deterministic code for arithmetic, schema validation, hard constraints and reproducible tests. Review source-linked explanations and uncertainty before accepting results. One approved data model and permission set; final data interpretation and publication checks remain with the data owner. A model suggestion is never a verified fact, professional decision or authorization to act.
Safeguards
Preserve data lineage, source attribution, access permissions and usage rights. Data owners approve substantive changes and publication scope. One approved data model and permission set; final data interpretation and publication checks remain with the data owner. Keep all consequential actions under authorized human control and do not fabricate missing inputs, permissions, professional judgments or market evidence.
What to build first
Pilot scope: One approved data model and permission set; final data interpretation and publication checks remain with the data owner. Implement one approved input format, a bounded representative case set and the first two task modules: connect to external databases, warehouses and files; clean and restructure data for analysis. Support the third module with operator review: write and edit queries in an interactive editor. Include source references, corrections, basic organization access, approval states, export and value measurement. Use managed operator assistance for unresolved exceptions. The cost estimate covers this narrow prototype, not unrestricted multi-tenant scale, complex production integrations, specialist certification or physical operations.
What it can connect to
Customer-owned databases, warehouses and files. Cloud storage, browser extension and publishing destinations. Start with file exchange and validate destination specifications before promising direct publishing. Start with authorized file exchange. Validate current provider access, usage rights and schema behavior before promising a connector.
The screens in detail
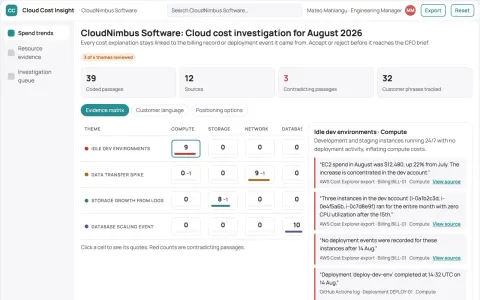
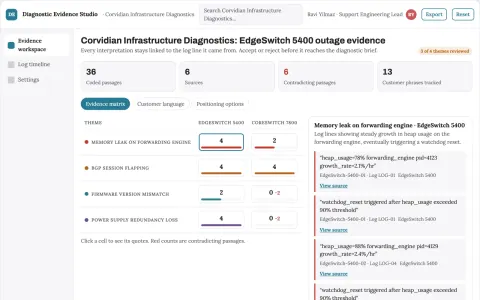
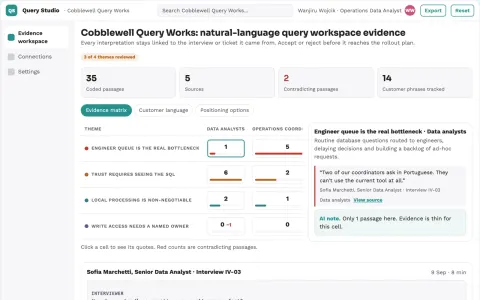
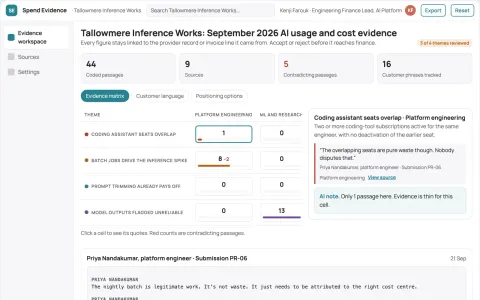
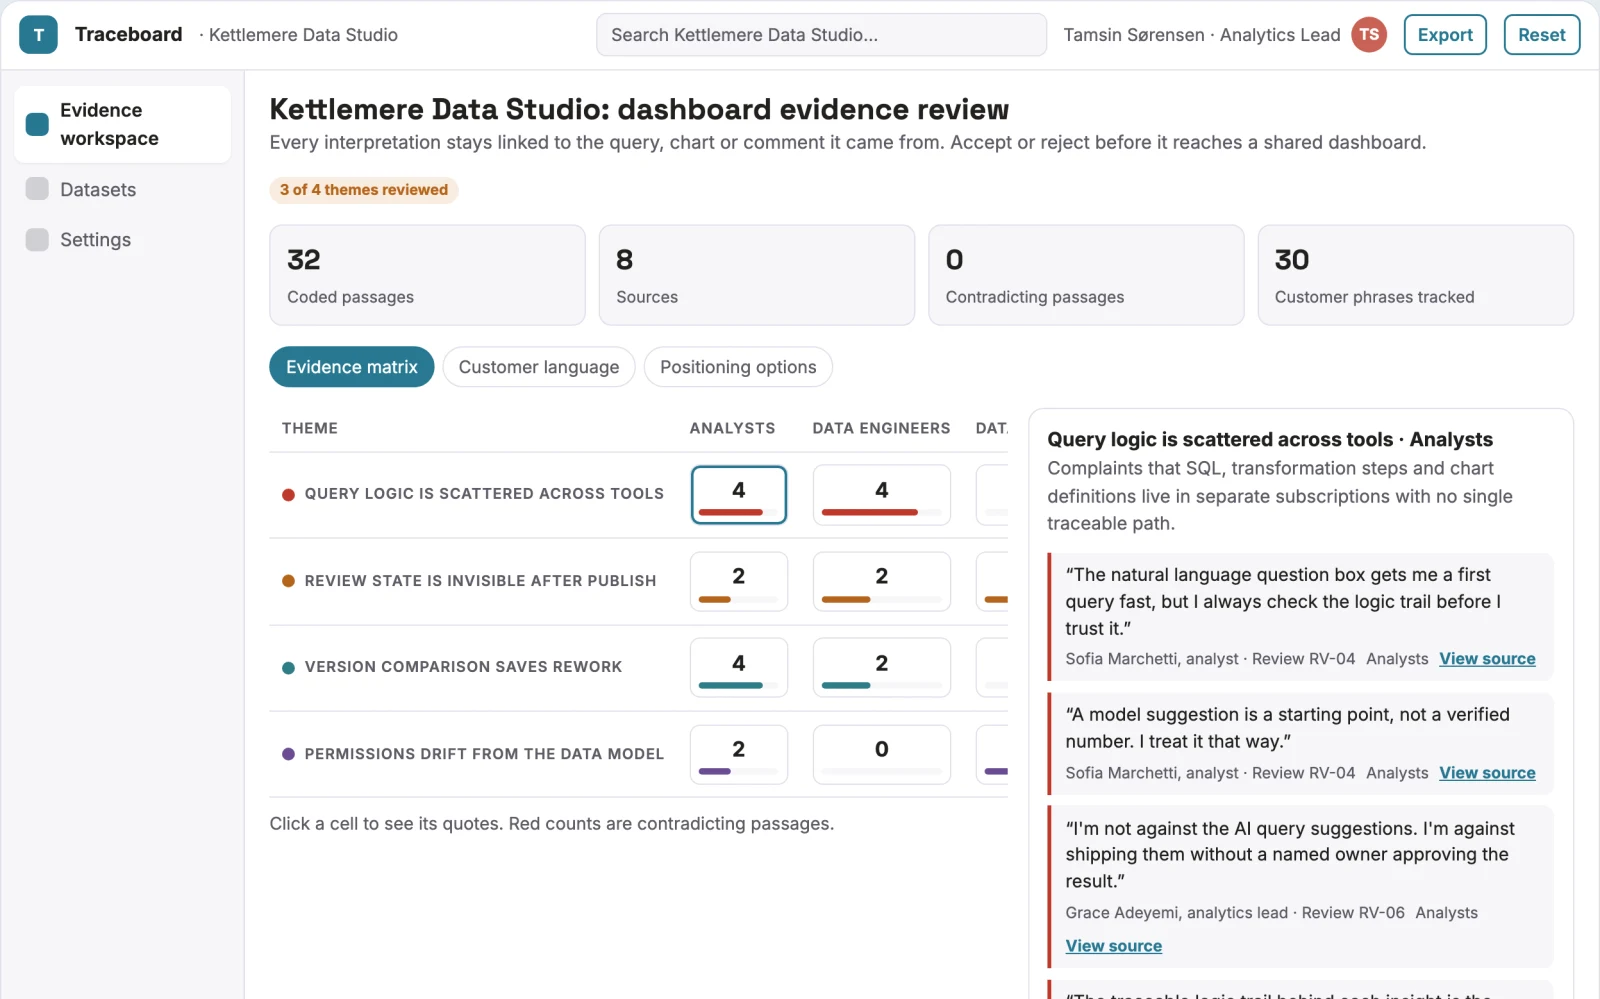
Primary screens: Data source and query setup, Editable visualization canvas, Review and sharing. Use a thumbnail gallery for projects, a large central canvas for charts and diagrams, and a right-hand panel for query logic, transformation steps, permissions and comments. Let users compare versions side by side. Display draft, changes requested and approved states. Provide a client preview link with comments anchored to the relevant chart or node. Make the task-specific outcome approved interactive visualization linked to its evidence visible beside its evidence, review state and value baseline.