AI agent for epidemiologists
Confounder Sensitivity Analysis Agent
A sensitivity section that shows which conclusions survive alternate adjustment and unmeasured confounding
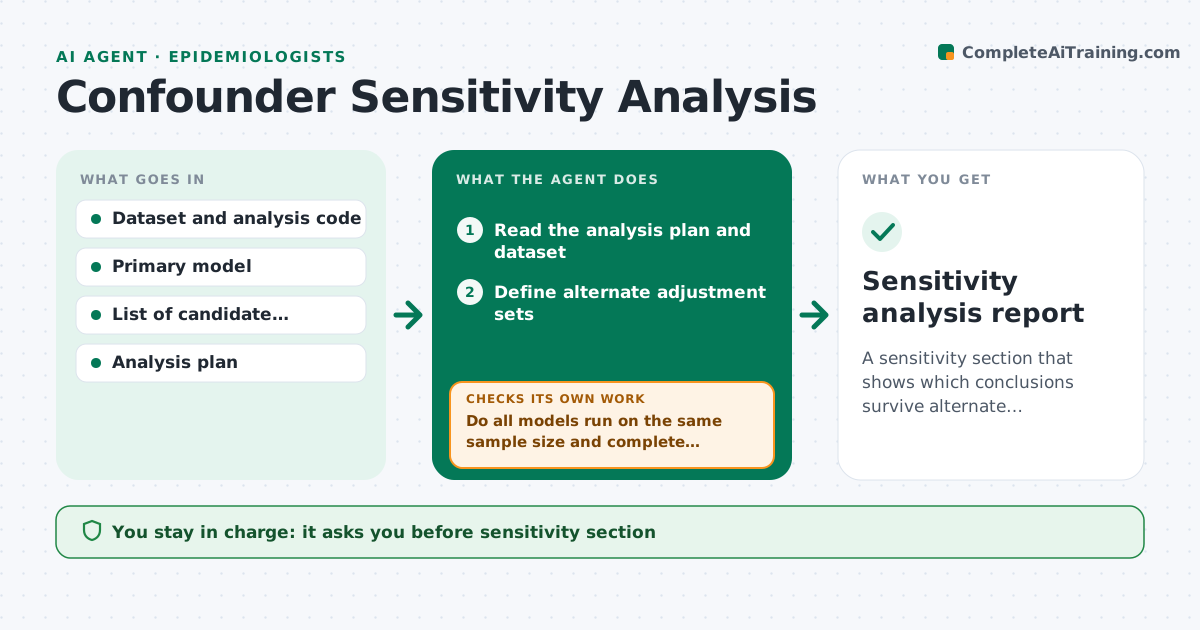
What it does
Observational study results are often reported with one adjustment set, and readers cannot tell whether unmeasured confounding could explain the effect. This agent reruns the models with alternate adjustment sets, then computes bounds for how strong an unmeasured confounder would need to be to change the finding, such as an E-value. It flags results that flip sign or lose significance, and states which conclusions hold. It rechecks the models when new covariates are added. It also checks that every model ran on the same sample. The analyst approves the sensitivity section. Edge case: adding one covariate removes 20 percent of the sample, so the agent flags the change before comparing results.
How it works
Follow the arrows from top to bottom. The orange dashed arrow is the loop: when a check fails, the agent goes back and tries again.
Read the steps as a list
- Primary analysis complete
- Read the analysis plan and dataset
- Define alternate adjustment sets
- Rerun the models for each set
- Do all models run on the same sample size and complete cases?If not: align the sample or record the difference. Back to step 3.
- Compute bounds for unmeasured confounding
- Compare estimates across sets and flag sign or significance changes
- Do the flagged results survive when new covariates are added?If not: rerun with the extra covariates and compare. Back to step 4.
- Draft the sensitivity table and text
- Analyst approves the sensitivity sectionThe agent waits here for your OK.
- Sensitivity analysis report
How it decides
A conclusion is robust when it keeps its direction and significance across the alternate sets and the confounder bound is large.
- Flag a result when the estimate changes sign or the interval crosses the null
- Use the same complete cases for all sets
- Report the confounder strength needed to explain the result
- Prespecify the sets and note any extra ones
Make it yours
Every agent is a starting point. You choose these settings for your own situation.
- Adjustment sets to test
- Significance level (default 0.05)
- Confounding measure
- Sample handling rule
What keeps you in control
It always asks you first
- Sensitivity section
- Any change to the primary analysis
Hard limits
- Never changes the primary analysis
- Never describes a result as causal
It stops when
- Done: all sets run and conclusions classified
- Stop: dataset lacks the covariates
Set it up
We guide you through the set-up, step by step
Members get the full set-up guide for this agent. No technical skills needed: you copy, paste and upload.
- One set of instructions to paste into your AI, with the clicks for ChatGPT, Claude, Microsoft 365 Copilot, Gemini and Grok
- The agent then walks you through connecting your own data, one source at a time
- A downloadable copy with the flow chart, the rules and the full guide