AI agent for epidemiologists
Surveillance Case Report Reporting Delay Agent
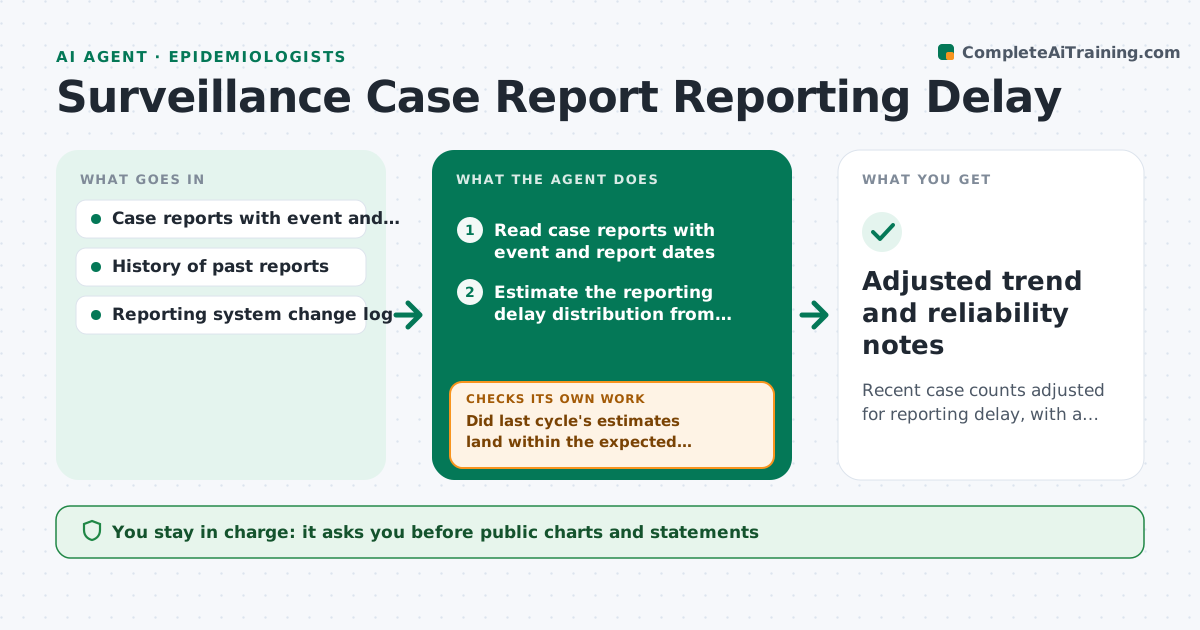
Recent case counts adjusted for reporting delay, with a clear flag where the adjustment is unreliable
What it does
Surveillance counts for the most recent weeks look like a decline simply because reports have not arrived yet. This agent estimates how long reports take to arrive using past data, then adjusts recent counts to what they will probably become. It compares the adjusted trend to the raw one, and flags weeks where the adjustment is unreliable, such as when a reporting system changed or few reports have arrived. As each new batch comes in, it compares its estimate to what actually arrived and updates the delay curve. The lead approves what is shown to the public. Edge case: a lab system outage delayed one week's reports, so the agent excludes that week from the delay estimate.
How it works
Follow the arrows from top to bottom. The orange dashed arrow is the loop: when a check fails, the agent goes back and tries again.
Read the steps as a list
- Surveillance data refreshed
- Read case reports with event and report dates
- Estimate the reporting delay distribution from past weeks
- Adjust recent counts to expected final counts
- Did last cycle's estimates land within the expected interval of the actual counts?If not: reestimate the delay curve and exclude outage weeks. Back to step 3.
- Compare adjusted and raw trends
- Is each recent week's adjustment factor below the reliability limit?If not: mark the week unreliable and show only the raw count. Back to step 3.
- Draft the chart and notes
- Lead approves what is shown to the publicThe agent waits here for your OK.
- Adjusted trend and reliability notes
How it decides
The delay curve comes from reliable past weeks. An adjusted week is marked unreliable when the adjustment factor is above 2 or the sample for the curve is small.
- Mark a week unreliable when the adjustment factor exceeds 2
- Exclude weeks affected by system outages from the delay curve
- Show the raw count alongside any adjusted count
- Update the curve every cycle
Make it yours
Every agent is a starting point. You choose these settings for your own situation.
- Reliability limit (default factor of 2)
- Weeks of history used
- Uncertainty interval
- Reporting delay definition
What keeps you in control
It always asks you first
- Public charts and statements
Hard limits
- Never publishes counts
- Never hides the raw numbers
It stops when
- Done: adjusted trend ready and approved
- Stop: not enough history to estimate delays
Set it up
We guide you through the set-up, step by step
Members get the full set-up guide for this agent. No technical skills needed: you copy, paste and upload.
- One set of instructions to paste into your AI, with the clicks for ChatGPT, Claude, Microsoft 365 Copilot, Gemini and Grok
- The agent then walks you through connecting your own data, one source at a time
- A downloadable copy with the flow chart, the rules and the full guide