AI agent for epidemiologists
Vaccine Coverage Gap Mapping Agent
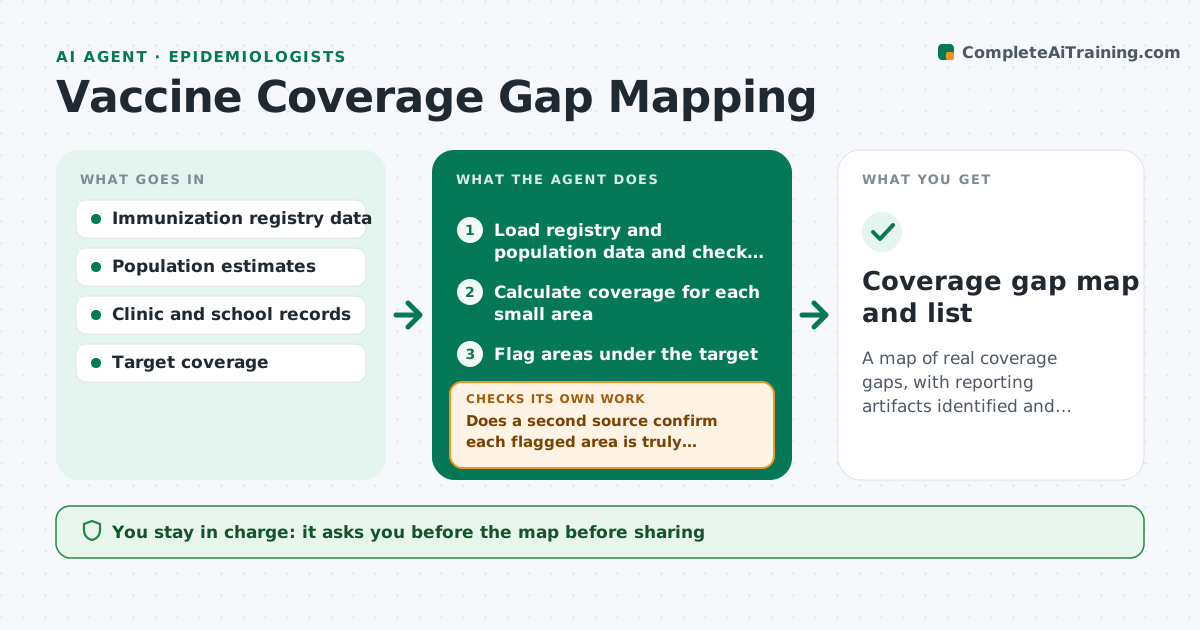
A map of real coverage gaps, with reporting artifacts identified and removed.
What it does
Coverage looks fine at the district level while a few neighborhoods sit well below target, and sometimes the low number is just a data problem. This agent combines registry and population data, checks data quality, and calculates coverage by small area. It flags the low areas, then tests whether each gap is real or an artifact, such as a wrong population denominator, missing registry submissions, or a clinic not reporting. It rechecks flagged areas with a second source, such as school records or clinic counts. It builds a map and a list. You approve the map before it is shared. Edge case: small areas with fewer than a set number of people use pooled estimates to avoid false alarms.
How it works
Follow the arrows from top to bottom. The orange dashed arrow is the loop: when a check fails, the agent goes back and tries again.
Read the steps as a list
- Registry data loaded
- Load registry and population data and check basic quality
- Calculate coverage for each small area
- Flag areas under the target
- Does a second source confirm each flagged area is truly low?If not: check denominators, missing clinic reports and duplicates, then recalculate. Back to step 4.
- Pool or smooth very small areas
- Do the flagged areas remain under target after pooling?If not: remove them from the list and note the uncertainty. Back to step 4.
- Build the map and the list of confirmed gaps with causes
- Epidemiologist approves the mapThe agent waits here for your OK.
- Coverage gap map and list
How it decides
An area is low if coverage is under target with enough population. It is real when a second source or a data check confirms it.
- Area population under 100: use pooled estimates
- Clinic with no submissions this month: possible artifact, ask for data
- Coverage under the target by over 10 points and confirmed: priority area
- Denominator differs from census by over 20 percent: recheck before use
Make it yours
Every agent is a starting point. You choose these settings for your own situation.
- Target coverage (default 90 percent)
- Small area size rule
- Second sources used
- Geography level
- Update schedule
What keeps you in control
It always asks you first
- The map before sharing
- Outreach plans based on it
Hard limits
- Never share maps with individual-level data
- Never present a gap without a data check
It stops when
- Done: map approved
- Stop: registry data incomplete
Set it up
We guide you through the set-up, step by step
Members get the full set-up guide for this agent. No technical skills needed: you copy, paste and upload.
- One set of instructions to paste into your AI, with the clicks for ChatGPT, Claude, Microsoft 365 Copilot, Gemini and Grok
- The agent then walks you through connecting your own data, one source at a time
- A downloadable copy with the flow chart, the rules and the full guide