AI tool
telemetry.dev
telemetry.dev traces every model call and tool call for AI agents so developers can see which step failed and what a run cost. It includes prompt management, evals, and error alerts, with SDKs for OpenAI, Anthropic, and LangChain.
About telemetry.dev
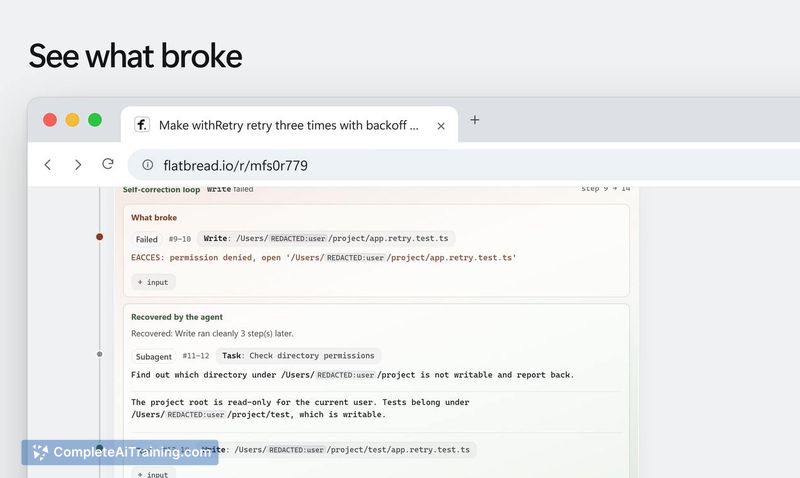
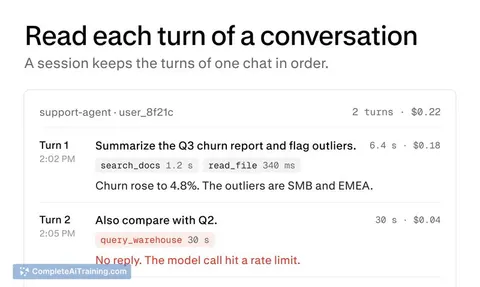
telemetry.dev is an LLM observability tool built for AI agents, launched this week. It represents each agent run as a single trace where every model call and tool call appears as a span containing duration, token usage, cost, and error data. The tool connects via TypeScript or Python SDKs, or through an existing OpenTelemetry exporter.
Review
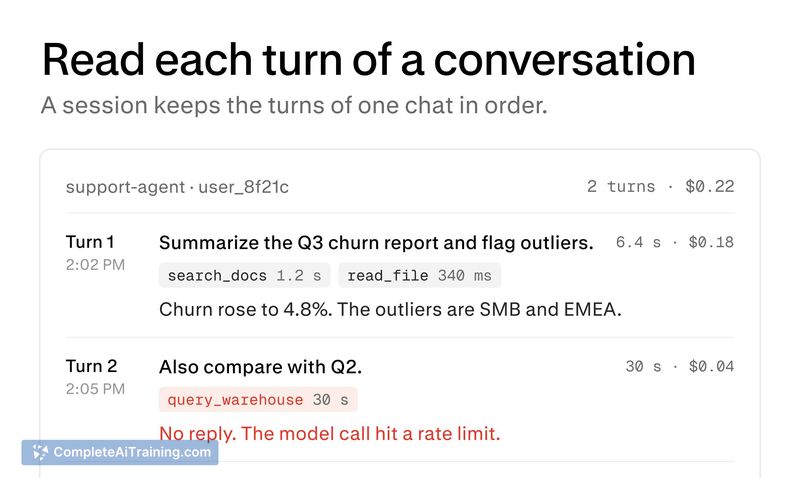
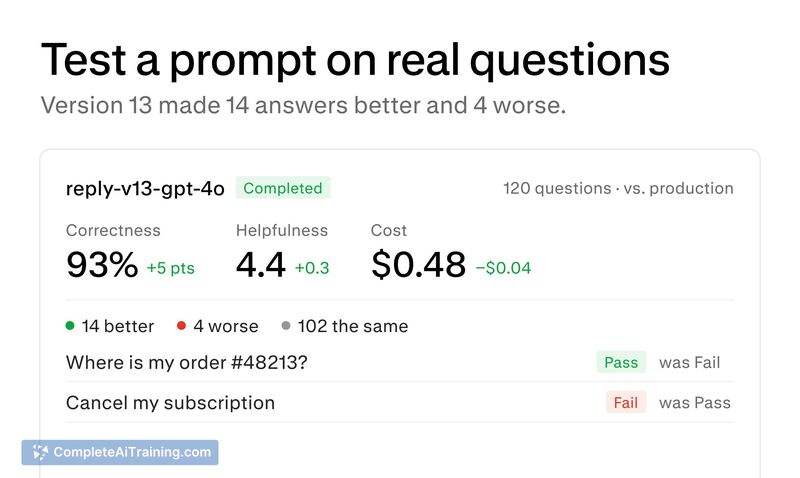
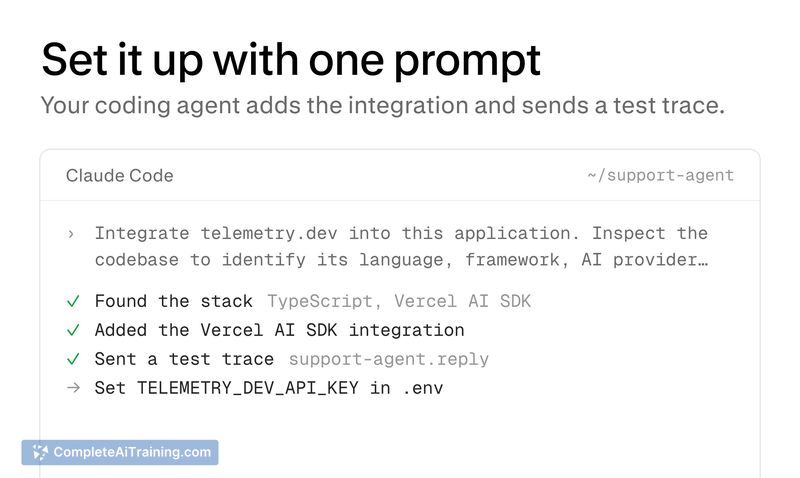
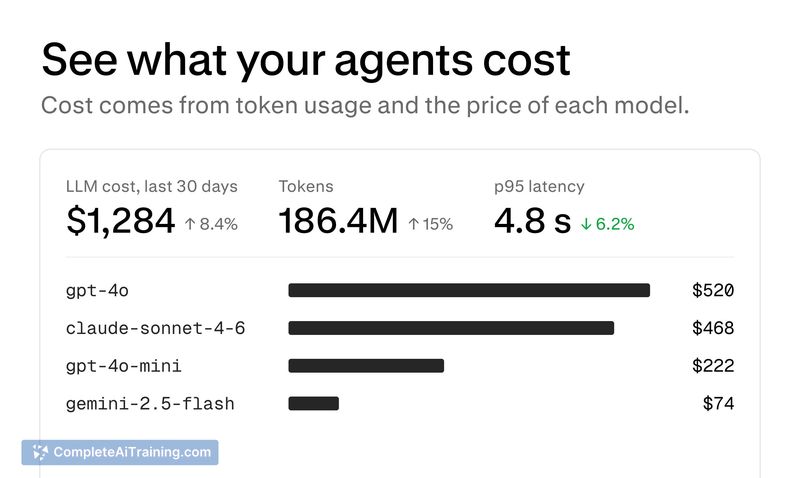
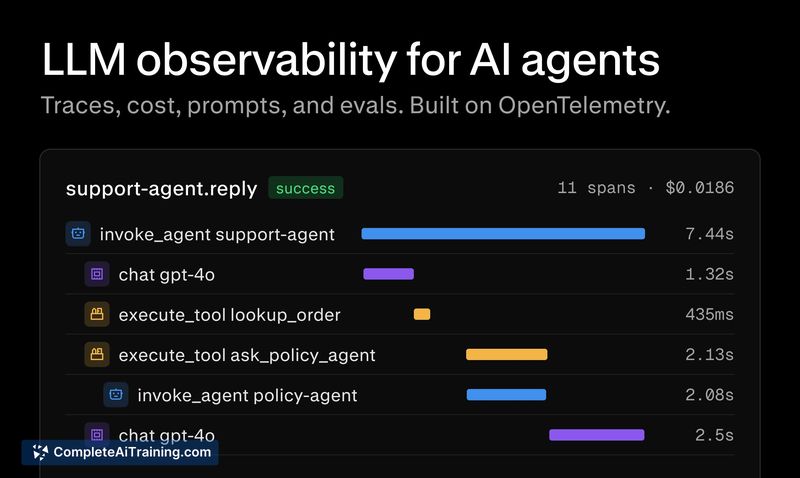
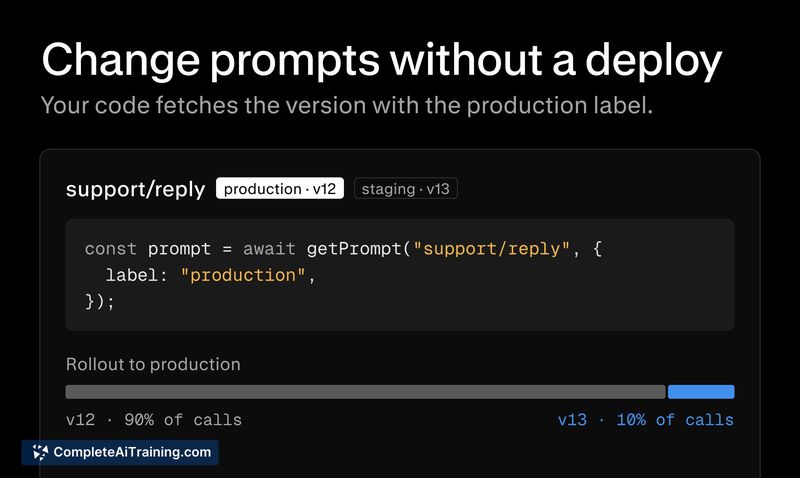
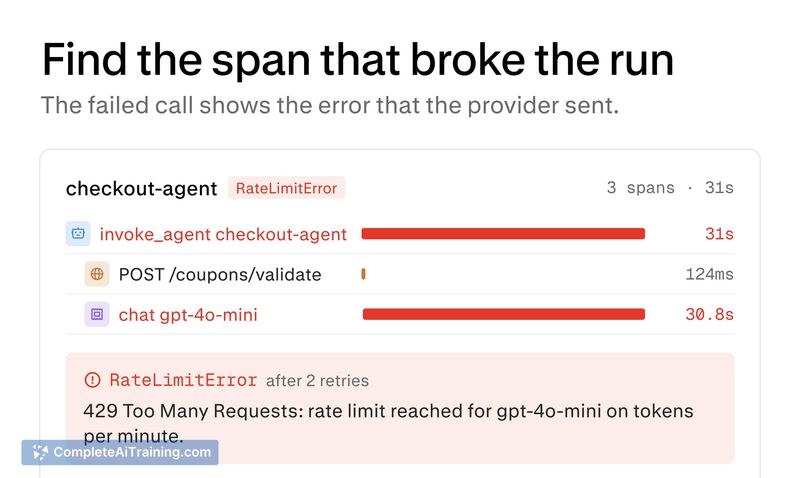
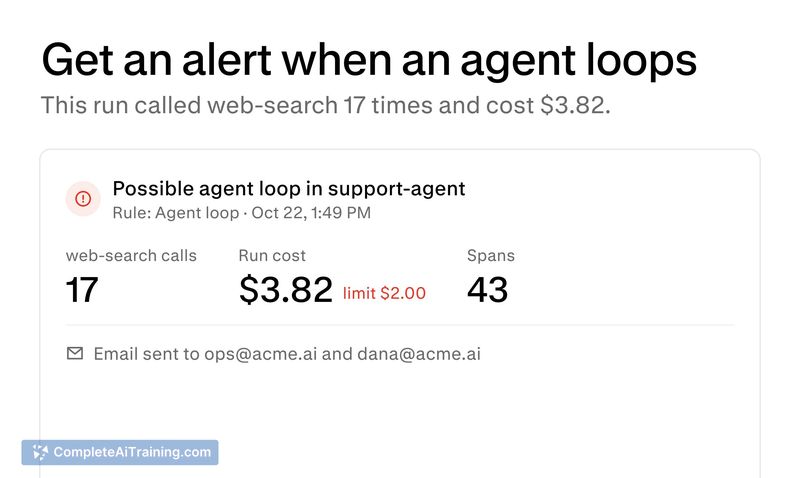
Debugging AI agents in production presents a specific set of challenges: you need to know which step failed and what that failure cost. telemetry.dev addresses this by structuring agent runs into traces and spans, giving developers a chronological view of what happened during each execution. The tool also folds prompt management and evaluations into the same tracing system, which means you can test prompt changes against datasets and compare scores without a separate deployment workflow.
Key Features
- Trace-based observability: Each agent run appears as one trace. Model calls and tool calls are spans that record duration, tokens consumed, cost incurred, and any errors that occurred.
- Prompt management: Change a prompt without deploying. You can run a new prompt version on a dataset and compare evaluation scores with production traces.
- Alerts: The system notifies you when errors accumulate, costs spike, or an agent gets stuck in a loop.
- CLI and MCP server: A command-line interface and an MCP server let a coding agent read your traces. By default, the agent sees steps, timing, tokens, cost, and errors - not full prompt or tool input payloads.
- Data redaction: API keys, tokens, passwords, emails, phone numbers, and card numbers are redacted before storage. You can add custom patterns or mask data in the SDK so it never leaves your application.
Pricing and Value
Pricing is per event, not per token. The Team plan costs $50 per month for 2 million events. Overage charges are not yet implemented, though the maker has indicated they are planned. A free plan exists that requires no credit card, and a promotional code (PHBU7A47FH) provides one month of the Pro tier at no cost. Self-hosting is not available. The tool does not perform sampling on its side; you can use any OpenTelemetry sampler you prefer.
Pros
- Traces group an entire agent run into one view, so you see the full sequence of model and tool calls rather than disconnected events.
- Prompt changes and evaluations live inside the same tracing system, removing the need to deploy before testing against production data.
- Built on OpenTelemetry, which means teams already using OTEL can connect without adopting a new protocol.
- Redaction happens before storage, and the MCP integration hides prompt and tool input payloads by default unless you explicitly enable them.
- Per-event pricing decouples cost from token volume, which can simplify budgeting for high-throughput agents.
Cons
- The tool cannot group MCP tool calls into a single trace from the server side alone when the client (such as claude.ai) doesn't send a trace or conversation ID. A workaround exists using session IDs, but it depends on the model remembering to pass them back.
- Self-hosting is not an option, which may be a constraint for teams with strict data residency or infrastructure requirements.
- This tool is not well suited for teams that only need basic LLM call logging without agent-specific tracing. If your application makes single model calls with no tool use or multi-step agent loops, a simpler logging solution may cover your needs.
telemetry.dev fits teams that run multi-step AI agents and need to trace failures across model calls and tool invocations in one place. The prompt evaluation workflow makes it practical for developers who iterate on prompts frequently and want to compare versions against production traces before shipping. Teams that rely on OpenTelemetry will find the integration straightforward, while those needing on-premise deployment or working with clients that don't propagate trace context will encounter limitations.