AI agent for presentation designers
Deck Chart Data Accuracy Agent
Every number and chart in the deck matches the source data
What it does
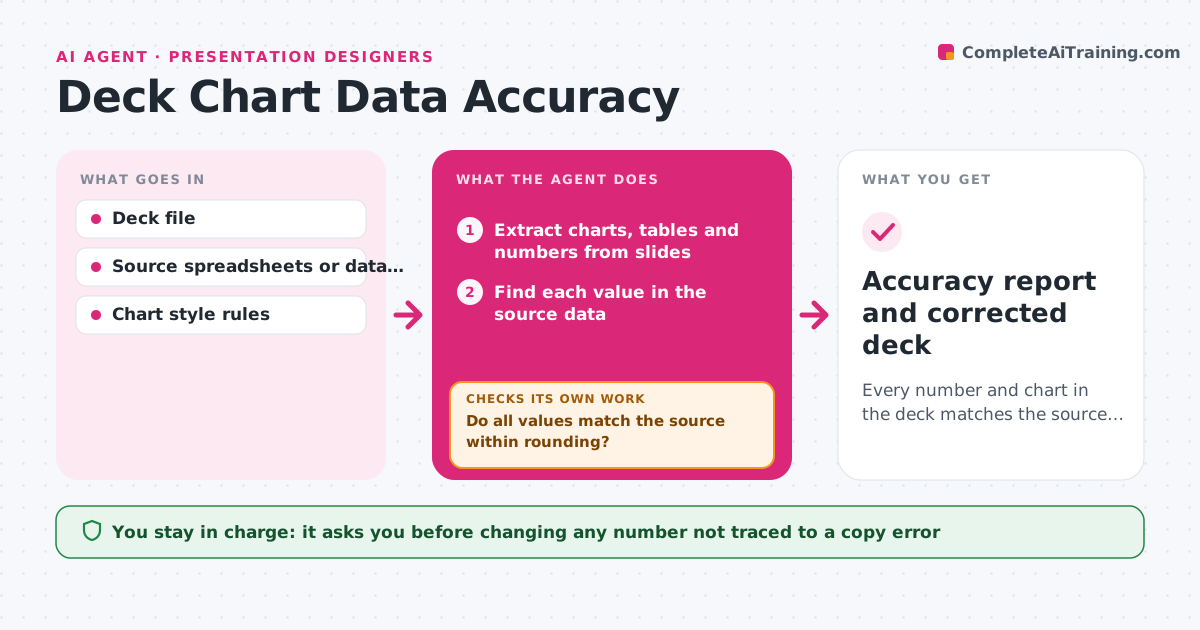
Numbers change on the way from the analyst's spreadsheet to the final slide: rounding, old values copied over, wrong labels or bar charts whose axis starts above zero. This agent reads every chart, table and number on the slides and traces each one back to the source file. It compares values, totals, units, labels and axis starts. Each mismatch is listed with the slide, the shown value and the source value. It fixes what is clearly a copying error and asks you about anything that may be a deliberate change. After fixes, it checks the whole deck again, and also checks that numbers repeated across slides agree with each other. The owner confirms flagged items. Edge case: segment shares that add up to 101% because of rounding get a note rather than a silent change.
How it works
Follow the arrows from top to bottom. The orange dashed arrow is the loop: when a check fails, the agent goes back and tries again.
Read the steps as a list
- Deck version is ready for review
- Extract charts, tables and numbers from slides
- Find each value in the source data
- Compare values, units, labels and axis starts
- Do all values match the source within rounding?If not: fix clear copying errors and flag the rest, then recheck. Back to step 3.
- Do repeated numbers agree across slides?If not: align them with the source and recheck. Back to step 4.
- Prepare accuracy report with each change
- Owner confirms flagged changesThe agent waits here for your OK.
- Accuracy report and corrected deck
How it decides
A value passes if it matches the source after the agreed rounding. Mismatches that look like copying errors are fixed; others are flagged.
- Accept differences within the agreed rounding
- Flag axis starts above zero on bar charts
- Ask before changing any number that is not a clear copy error
Make it yours
Every agent is a starting point. You choose these settings for your own situation.
- Rounding rule (default one decimal)
- Chart style rules to enforce
- Which sources count as the master
- Report format
What keeps you in control
It always asks you first
- Changing any number not traced to a copy error
- Releasing the deck
Hard limits
- Never invents data to fill a chart
- Keeps the original deck untouched
It stops when
- Done: all values match or are approved
- Stop: source file missing for a chart; ask for it
Set it up
We guide you through the set-up, step by step
Members get the full set-up guide for this agent. No technical skills needed: you copy, paste and upload.
- One set of instructions to paste into your AI, with the clicks for ChatGPT, Claude, Microsoft 365 Copilot, Gemini and Grok
- The agent then walks you through connecting your own data, one source at a time
- A downloadable copy with the flow chart, the rules and the full guide