AI agent for biologists
Growth Curve Fitting Agent
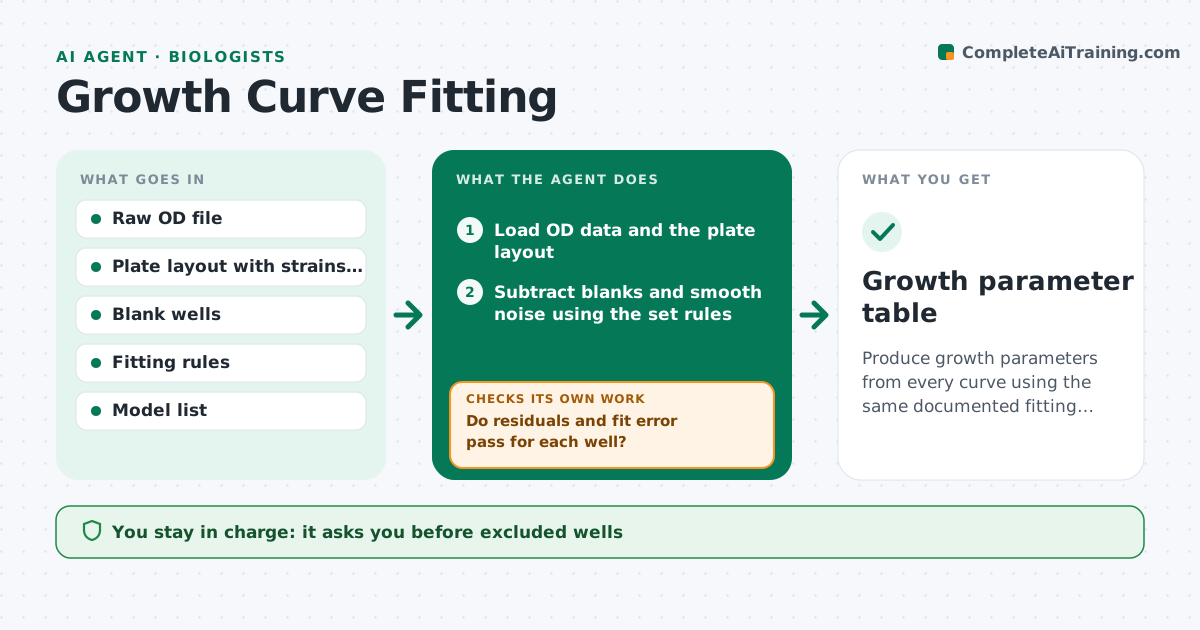
Produce growth parameters from every curve using the same documented fitting rules.
What it does
Growth curves from plate readers are often fitted by hand in a spreadsheet, with a different start and end point for each person, so growth rates and lag times are not comparable. This agent reads the raw optical density files, subtracts blanks, and fits the same set of models to every well, such as a logistic, Gompertz or the exponential phase. It checks each fit against the data: residual pattern, goodness of fit, a sensible lag phase and no signs of contamination or evaporation. Wells that fail are refit with a different window or model, and listed if they still fail. It reports growth rate, lag and maximum density with ranges, and keeps the fitting rules in the report. It never drops a well alone. The scientist approves the final table. Edge case: a diauxic curve is flagged for a two-phase fit.
How it works
Follow the arrows from top to bottom. The orange dashed arrow is the loop: when a check fails, the agent goes back and tries again.
Read the steps as a list
- Plate reader file uploaded
- Load OD data and the plate layout
- Subtract blanks and smooth noise using the set rules
- Fit the model list to each well
- Do residuals and fit error pass for each well?If not: refit with another window or model and note the change. Back to step 4.
- Flag wells with contamination, evaporation or two growth phases
- Fit two-phase models for flagged diauxic curves
- Are replicate wells consistent within the allowed spread?If not: list inconsistent replicates and recheck the layout and raw curves. Back to step 4.
- Write the results table with ranges and fit notes
- Scientist approves the table and any excluded wellsThe agent waits here for your OK.
- Growth parameter table
How it decides
It chooses the simplest model with acceptable residuals, and uses the same window rules for every well so that results are comparable.
- Use the same exponential window rule for all wells in a plate
- Accept a fit when the residuals show no trend and R squared is above 0.98
- Flag replicates differing by more than 15% in growth rate
- Treat a late OD drop as a possible evaporation or lysis sign
Make it yours
Every agent is a starting point. You choose these settings for your own situation.
- Model list
- Fit acceptance level (default R squared 0.98)
- Replicate spread limit (default 15%)
- Blank handling
- Report format
What keeps you in control
It always asks you first
- Excluded wells
- The final results table
Hard limits
- Never delete raw data
- Keep the fitting rules the same across a plate
It stops when
- Done: all wells fitted or excluded with a reason
- Stop: layout does not match the file
Set it up
We guide you through the set-up, step by step
Members get the full set-up guide for this agent. No technical skills needed: you copy, paste and upload.
- One set of instructions to paste into your AI, with the clicks for ChatGPT, Claude, Microsoft 365 Copilot, Gemini and Grok
- The agent then walks you through connecting your own data, one source at a time
- A downloadable copy with the flow chart, the rules and the full guide