AI agent for chief operating officers
Sustainability Operations Data Collection Agent
Collect complete, checked monthly energy, fuel, water and waste data for every site
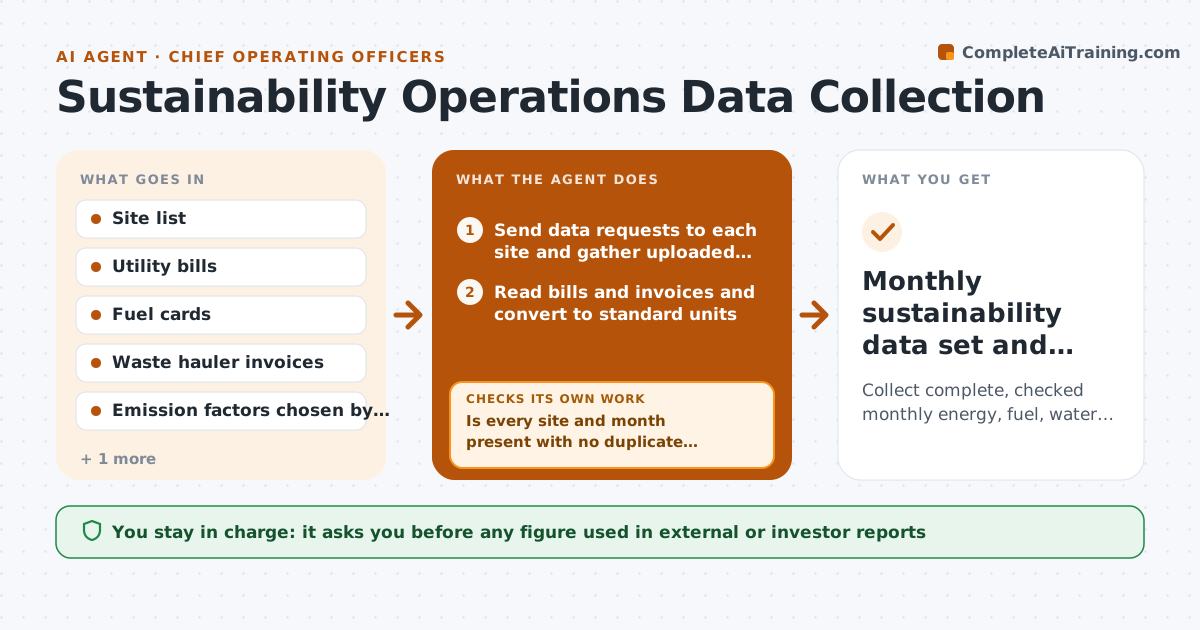
What it does
Sustainability reports depend on site data that arrives late, in mixed units, with gaps. This agent runs the monthly collection. It sends each site a request for electricity, gas, fuel, water and waste figures, then reads utility bills and hauler invoices where sites upload them. It converts everything to standard units and compares each site with its own prior months and with similar sites. A figure more than 30% off its trend is queried with the site, not silently fixed. It also checks for missing months and duplicate bills. When a check fails, it goes back to the site or the bill. It then rolls up totals and drafts the monthly dashboard and progress against targets. The COO approves any figure used in external reports. Edge case: a site's meter was replaced mid-month, so two partial readings must be added, not averaged.
How it works
Follow the arrows from top to bottom. The orange dashed arrow is the loop: when a check fails, the agent goes back and tries again.
Read the steps as a list
- New month begins
- Send data requests to each site and gather uploaded bills
- Read bills and invoices and convert to standard units
- Is every site and month present with no duplicate bills?If not: remind the missing sites and remove duplicates found by account and period. Back to step 2.
- Compare each figure with the site trend and peer sites
- Are all figures within 30% of trend or explained?If not: query the site, correct the reading or record the reason. Back to step 3.
- Apply emission factors and roll up totals
- Draft dashboard and progress against targets
- COO approves figures for external useThe agent waits here for your OK.
- Monthly sustainability data set and dashboard
How it decides
It accepts a figure when it fits the site's trend; when it deviates more than 30% or units look wrong, it asks the site before using it.
- Query any figure more than 30% off the site's 12-month trend
- Treat a missing month as estimated only after two reminders, and label it estimated
- Use the company's chosen emission factors, never mix sources in one period
- Flag sites more than 10% behind their annual reduction path
Make it yours
Every agent is a starting point. You choose these settings for your own situation.
- Outlier threshold (default 30% from trend)
- Reminder schedule (default days 3 and 5)
- Emission factor source chosen by the company
- Sites and data types in scope
- Dashboard format
What keeps you in control
It always asks you first
- Any figure used in external or investor reports
- Switching to estimated data for a site
Hard limits
- Never publishes figures externally
- Never overwrites a site's reported figure without a recorded reason
- Labels every estimate as estimated
It stops when
- Done: all sites complete, outliers explained, dashboard drafted
- Stop: emission factors not set for the year, so it asks before calculating
Set it up
We guide you through the set-up, step by step
Members get the full set-up guide for this agent. No technical skills needed: you copy, paste and upload.
- One set of instructions to paste into your AI, with the clicks for ChatGPT, Claude, Microsoft 365 Copilot, Gemini and Grok
- The agent then walks you through connecting your own data, one source at a time
- A downloadable copy with the flow chart, the rules and the full guide