About: Graphy
Graphy is an intuitive data visualization platform that harnesses the power of AI to effortlessly transform raw data into interactive graphs and charts. Designed for marketers, analysts, and business professionals, Graphy streamlines the process of crafting visually compelling narratives, making it easier to convey insights and drive decision-making. With its user-friendly interface, users can quickly create professional-grade visualizations without needing extensive technical expertise. Key features include customizable templates, real-time data integration, and a variety of visualization options such as bar charts, line graphs, and heat maps. Graphy enhances collaboration by allowing teams to share and modify visualizations in real-time, ensuring that critical insights are accessible to all stakeholders. Its ability to simplify complex data sets into clear, engaging visuals sets Graphy apart, making it an invaluable tool for anyone looking to communicate data-driven insights effectively and efficiently. Transform your data storytelling with Graphy and empower your team to make informed decisions based on clear visual representations.
Review: Graphy
Introduction
Graphy is a user-friendly AI-powered data visualization tool designed to help marketers, analysts, and business professionals quickly transform raw data into compelling, interactive graphs and charts. With an aim to simplify data communication, Graphy is built for modern teams who need to drive decisions through clear and actionable insights. This review explores Graphy’s functionalities, its standout features, and overall value to help you determine if it meets your data storytelling needs.
Key Features
Graphy offers an impressive array of functionalities that set it apart from traditional data visualization tools:
- Interactive and AI-Driven Visualizations: Graphy leverages AI to automatically create charts and even explains key insights, making it an ideal choice for fast-paced environments.
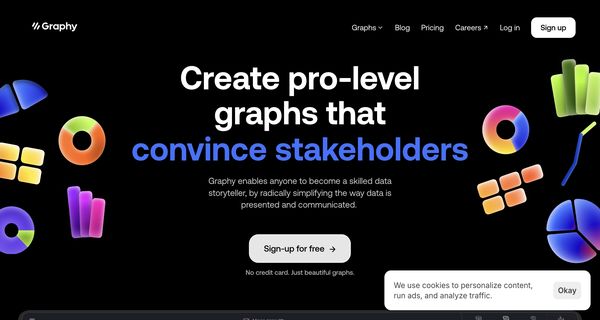
- User-Friendly Interface: With a remarkably simple and intuitive design, Graphy eliminates the learning curve, ensuring anyone can create pro-level graphs without technical expertise.
- Speed and Efficiency: Promising to be 80% faster than other tools, Graphy accelerates the process of generating and sharing visual data insights, thus streamlining team collaboration.
- Rich Storytelling Capabilities: Enhanced with visual annotations, one-click enhancements such as trend lines and goals, and the ability to connect with sources like Google Sheets, Graphy transforms data presentation into compelling narratives.
- Versatile Sharing Options: Graphs can be shared as embeds, interactive links, or images, fitting seamlessly into various presentation mediums including slides and popular workplace applications.
Pricing and Value
Graphy adopts a user-friendly pricing approach with a free sign-up option that does not require a credit card, lowering the entry barrier for teams and individuals looking to enhance their data visualization capabilities. This free offering makes it accessible for users who want to experience professional-quality graphing results before committing to any premium features.
Given its robust feature set and ease of use, Graphy presents an excellent value proposition for data-driven teams compared to more complex, traditional tools that may require extensive setup and training.
Pros and Cons
- Pros:
- Extremely fast and efficient in generating visualizations.
- Intuitive, no-learning-curve interface suitable for non-technical users.
- Rich AI-driven insights that automatically explain key data trends.
- Versatile sharing options that integrate well with modern workplace tools.
- Free sign-up model encourages easy adoption for teams of any size.
- Cons:
- The simplicity of the interface may limit advanced customization for power users.
- Users looking for highly specialized features might find the tool less flexible compared to more advanced platforms.
Final Verdict
Graphy is an excellent tool for professionals who need to quickly convert raw data into visually engaging and actionable charts. Its AI-driven insights, combined with a sleek and intuitive interface, make it an ideal solution for teams focusing on fast decision-making and clear communication. Marketers, analysts, and business professionals will find immense value in its ease of use and speed, while those requiring highly specialized analytics might need to complement it with more advanced tools.
Overall, Graphy stands out as a highly recommended solution for anyone looking to become a skilled data storyteller without the complexity of traditional data visualization software.
Open 'Graphy' Website
Your membership also unlocks: