Machine Learning Maps Ocean Currents from Weather Satellite Data
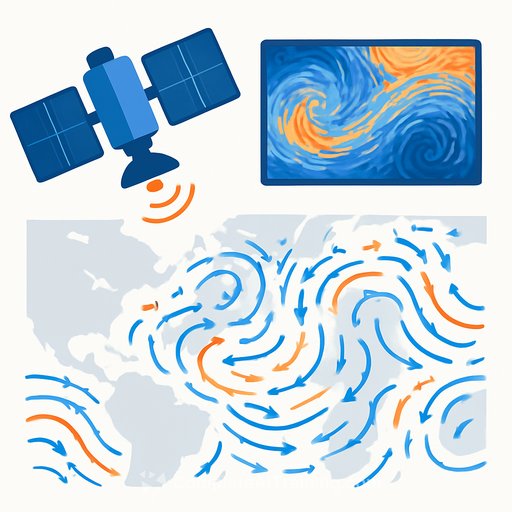
Oceanographers have developed a method to measure ocean surface currents at scales and speeds previously impossible to observe. The approach, called GOFLOW, applies deep learning to thermal images already collected by weather satellites, requiring no new hardware.
Luc Lenain at UC San Diego's Scripps Institution of Oceanography led the research with Kaushik Srinivasan at UCLA. The findings were published today in Nature Geoscience.
The Observation Gap
Ocean currents transport heat around the globe, move carbon between the atmosphere and ocean interior, and redistribute nutrients that sustain marine life. They also matter for search-and-rescue operations and tracking oil spills.
Existing methods have significant limits. Satellites that estimate currents by measuring sea-surface height typically image the same location only every 10 days-too infrequently to track currents that can appear and disappear within hours. Ship-based measurements and coastal radar systems capture rapid changes but only for limited areas.
This leaves a persistent gap at the scales where most vertical mixing occurs-the process that brings nutrients up from depth and pumps carbon dioxide to deeper waters. These phenomena can be less than 10 kilometers wide and transform in hours.
How GOFLOW Works
In 2023, Lenain was examining thermal imagery from GOES-East, a geostationary satellite primarily used for weather. The images, produced as frequently as every five minutes, showed warm and cool water patterns evolving on the sea surface.
Lenain recognized that major currents like the Gulf Stream left visible imprints in these temperature patterns. He began exploring how to convert visual observation into quantitative current measurements.
The team trained a neural network to recognize how ocean surface temperature patterns shift when pushed by underlying currents. The network learned from high-resolution computer simulations that provided examples of temperature patterns and the water velocities that created them.
By tracking how temperature patterns moved across consecutive satellite images, the trained network could infer the currents responsible for those changes.
Validation and Results
Researchers tested GOFLOW by comparing its output to shipboard instruments in the Gulf Stream region and standard satellite methods. GOFLOW's measurements aligned with both ship data and traditional satellite techniques.
The method revealed much greater detail for smaller, faster-moving eddies and boundary layers where existing methods showed only blurred averages. For the first time, researchers measured key statistical signatures of small, intense currents that drive vertical mixing-phenomena previously documented only in computer simulations.
"Using GOFLOW, we can now measure key signatures of these small, intense currents using real observations rather than relying almost entirely on simulations," said Lenain.
Practical Applications and Limitations
Because GOFLOW works with existing geostationary satellites, it requires no new instruments in orbit. Over time, the method could be incorporated into weather forecasts and climate models to improve predictions of air-sea exchange, marine debris transport, and ocean ecosystems.
Cloud cover remains a limitation-clouds block the thermal imagery GOFLOW depends on. The researchers are working to incorporate other satellite data types to fill gaps and achieve continuous coverage globally.
The study's data products and computer code are being made publicly available. The research was supported by grants from the Office of Naval Research, NASA, and the European Research Council.
For those interested in how machine learning applies to scientific problems, explore AI for Science & Research or AI Research Courses to learn more about these techniques in practice.
Your membership also unlocks: