Transforming Restaurant Operations with AI at the Edge: TableWatch by DifiNative
Costs are up, staffing is tight, and your peak window still drives most of your revenue. In many cities, commercial rent climbs 8-15% each year. Meanwhile, less than a quarter of the day generates 60-70% of sales.
In that window, every table turn counts. Miss one reset and you leave money on the floor. For multi-location operators, the challenge multiplies: different layouts, fluctuating labor, and inconsistent execution create blind spots you can't afford.
That's why real-time visibility and short-loop decision support are no longer optional. Digital twins of outlets, grounded in visual data, help you run at the speed of service while feeding long-term business intelligence.
What TableWatch Does
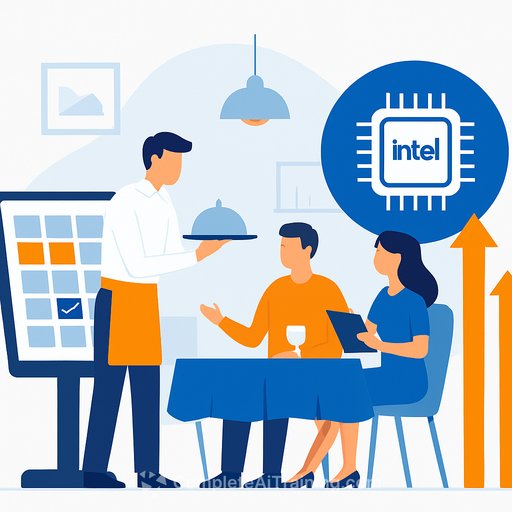
DifiNative's TableWatch, powered by SquirrelVision, applies vision AI to track table occupancy, service status, and readiness using live video. No guessing, no radio chatter, just a clear, always-on picture of your floor.
- Reduce wait times by instantly flagging available and clean tables
- Prioritize staff actions with simple, live dashboards
- Lift revenue by 5-10% through faster turns and fewer idle minutes
- Drive consistent execution across outlets with shared metrics and workflows
Think of it as a silent supervisor. It surfaces what matters now-seat, serve, reset-so teams move with purpose when the line is out the door.
How It Works: Low-Latency AI at the Edge
TableWatch runs fully at the edge for responsiveness and privacy. No dependency on constant cloud connectivity.
- Intel Core processors with Intel UHD Graphics process video with minimal delay
- OpenVINO toolkit accelerates inference using INT8 precision for efficient throughput
- Dynamic CPU scaling maintains performance while limiting energy waste
The result: fast, reliable insights, compliance-friendly data handling, and a footprint that scales from a single site to nationwide deployment.
From Visual Signals to a Living Digital Twin
SquirrelVision converts camera feeds into structured business data. That data updates a practical digital twin-your current floor status, not a static diagram.
- Restaurants, cafes, hotels: occupancy, turn status, service pacing
- Retail: shelf availability, queue monitoring, merchandising checks
- Manufacturing: line status, safety zones, compliance cues
- Warehouses and logistics: dock activity, access points, flow bottlenecks
- Public infrastructure and utilities: site monitoring, access compliance
If it's visible, it can become operational intelligence.
Operator Playbook: Deploy in Weeks, Not Months
1) Define Outcomes
- Target metrics: average table turn time, wait time at peak, seating accuracy, server lag between courses
- Set thresholds: "table ready" within X minutes after payment, "seat next party" within Y minutes
2) Start with One Pilot Site
- Select a high-traffic outlet with known bottlenecks
- Map camera coverage to tables, bussing stations, and entry points
- Run side-by-side with current SOPs for two weeks
3) Train the Team
- Host short, role-based sessions: hosts on seating prompts, servers on service status, bussers on reset alerts
- Make the dashboard the source of truth during peak
4) Iterate Fast
- Tune alert thresholds to match site reality
- Document new SOPs and update checklists
- Lock in what works, then scale to 3-5 outlets
KPIs Worth Watching
- Average table turn time (by party size and daypart)
- Wait time at peak vs. staffing plan
- Table idle time between payment and reset
- Seat-to-serve interval for first item
- Throughput per hour and revenue per available seat hour (RevPASH)
- Variance across outlets after SOP standardization
ROI Snapshot
Simple math beats guesswork. If peak hours account for 65% of daily revenue and you reduce average turn time by 6 minutes, that can add one extra turn for several tables during rush. Multiply by average check size and days open, and a 5-10% lift becomes feasible.
Add lower walkaway rates and better staff allocation, and the compounding effect shows up fast on P&L.
Privacy and Compliance
Processing at the edge limits data movement and supports data sovereignty needs. Video stays local while the system outputs structured events to your dashboards.
Work with your legal and IT teams to set retention, access, and signage policies that match your market and brand standards.
Where This Fits with Intel's AI Edge Initiative
TableWatch aligns with Intel's broader push to make AI practical at the edge through optimized hardware, software, and deployment frameworks. For more on the stack behind solutions like this, see Intel's edge overview.
Next Steps for Operations Leaders
- Pick one location with the biggest peak-hour pain and run a 30-day pilot
- Instrument the floor, define 3 primary KPIs, and give the dashboard to the host stand
- Standardize the winning playbook, then roll out to similar layouts first
- Feed results into labor planning and forecasting to close the loop
If your team needs a fast primer on practical AI for frontline operations, browse role-based learning paths here: AI courses by job.
Bottom Line
Table turns pay the bills. TableWatch gives your team the live, visual feedback to seat, serve, and reset with less friction-site by site, shift by shift.
Start small, measure what matters, and scale what sticks. The outlets that move first will set the standard for speed and consistency in this cycle.
Your membership also unlocks: