AI agent for presentation designers
Data Source Refresh for Recurring Decks Agent
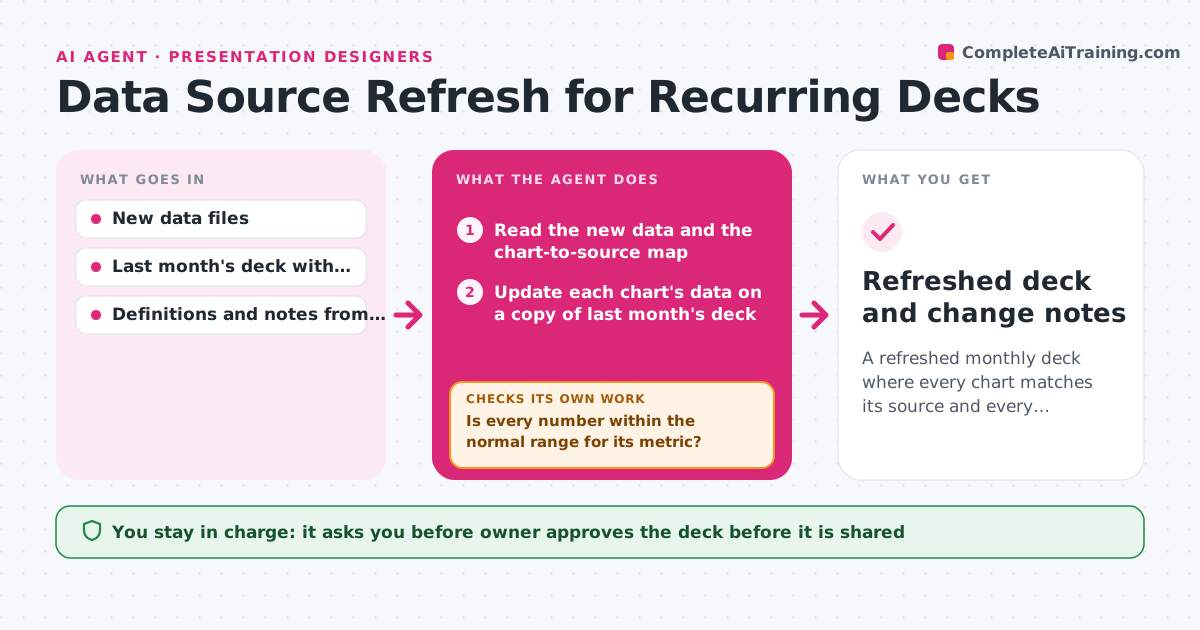
A refreshed monthly deck where every chart matches its source and every unusual change is explained
What it does
Every month the same ten charts need updating from fresh data, and every month one number is pasted into the wrong place. This agent reads the new data files, maps each chart to its source, and updates the chart data on a copy of last month's deck. It then compares the headline numbers against last month's and against the trend, and flags outliers such as a 40 percent jump in sales or a drop to zero. For each outlier, it goes back to the source to check for an error such as a missing row, a different date range or a changed definition before it accepts the number. It also checks that titles, dates and labels were updated. The owner approves the deck. Edge case: a metric whose definition changed this month is flagged with the note from the data owner.
How it works
Follow the arrows from top to bottom. The orange dashed arrow is the loop: when a check fails, the agent goes back and tries again.
Read the steps as a list
- Monthly data files ready
- Read the new data and the chart-to-source map
- Update each chart's data on a copy of last month's deck
- Update titles, dates and axis labels
- Compare headline numbers with last month and the trend
- Is every number within the normal range for its metric?If not: Go back to the source for each outlier and check the date range, missing rows and definitions. Back to step 2.
- Write a short note explaining each remaining unusual change
- Do all charts match their source totals after the refresh?If not: Correct the chart data and compare again. Back to step 3.
- Owner approves the deckThe agent waits here for your OK.
- Refreshed deck and change notes
How it decides
It accepts a number when it matches the source and sits within the normal range. Changes beyond the range are rechecked against the source before being kept.
- Flag changes of more than 25 percent from last month
- Always check the source date range for any outlier
- Flag any metric whose definition changed
- Keep last month's deck untouched
Make it yours
Every agent is a starting point. You choose these settings for your own situation.
- Outlier threshold (default 25 percent)
- Chart-to-source map
- Titles and labels to update
- Data owners to ask
- Deck template
What keeps you in control
It always asks you first
- Owner approves the deck before it is shared
Hard limits
- Never overwrite last month's deck
- Never share the deck with anyone
It stops when
- Done: Every chart matches its source and outliers are explained
- Stop: A data file is missing or unreadable, so the agent reports which chart cannot be updated
Set it up
We guide you through the set-up, step by step
Members get the full set-up guide for this agent. No technical skills needed: you copy, paste and upload.
- One set of instructions to paste into your AI, with the clicks for ChatGPT, Claude, Microsoft 365 Copilot, Gemini and Grok
- The agent then walks you through connecting your own data, one source at a time
- A downloadable copy with the flow chart, the rules and the full guide