AI agent for economists
Labor Market Indicator Dashboard Agent
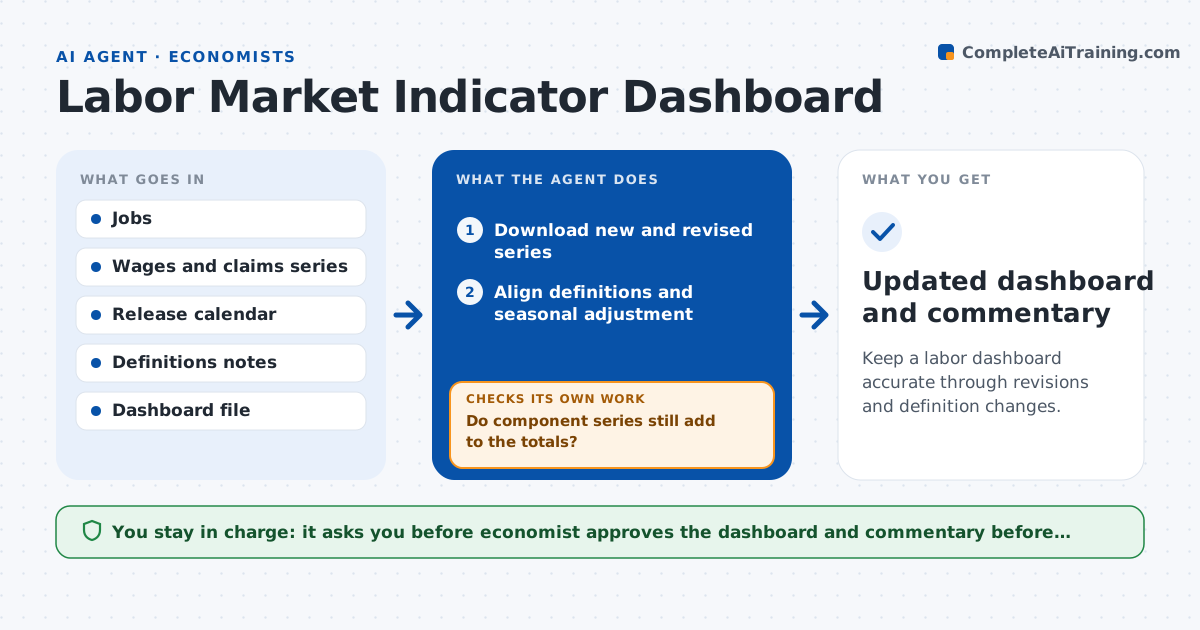
Keep a labor dashboard accurate through revisions and definition changes.
What it does
Labor data from several agencies uses different definitions, seasonal adjustments and revision schedules, so a dashboard built from them can mislead. This agent pulls jobs, wages and claims data from each source, aligns definitions and seasonal adjustment, and flags series breaks and revisions. After each refresh it checks that totals still reconcile, for example that industry jobs add to the total. If a revision breaks that tie, it finds the changed series and reloads it. It then updates the dashboard and drafts commentary on what changed and why. Edge case: a new survey base year can shift a whole series, so it notes the break. The economist approves before publishing.
How it works
Follow the arrows from top to bottom. The orange dashed arrow is the loop: when a check fails, the agent goes back and tries again.
Read the steps as a list
- New data release
- Download new and revised series
- Align definitions and seasonal adjustment
- Flag series breaks and large revisions
- Refresh the dashboard data
- Do component series still add to the totals?If not: find the revised or mismatched series and reload it. Back to step 2.
- Compare with the previous release and list what changed
- Draft commentary on the changes
- Is every flagged break or revision explained in a note?If not: read the source notes and add the explanation. Back to step 6.
- Economist approves before publishingThe agent waits here for your OK.
- Updated dashboard and commentary
How it decides
It refreshes a series only when its definition matches the dashboard standard and totals reconcile after the update.
- Flag a revision larger than 0.2 percentage points
- Reconcile components to totals within 0.1 percent
- Always show the break date on a chart with a series break
- Use the latest revision for all months
Make it yours
Every agent is a starting point. You choose these settings for your own situation.
- Series and agencies
- Revision flag level (default 0.2 points)
- Seasonal adjustment choice
- Commentary length
What keeps you in control
It always asks you first
- Economist approves the dashboard and commentary before publishing
Hard limits
- Never publishes the dashboard
- Notes every break and revision on the page
It stops when
- Done: dashboard approved and published by a person
- Stop: a major source has not released and totals cannot be checked
Set it up
We guide you through the set-up, step by step
Members get the full set-up guide for this agent. No technical skills needed: you copy, paste and upload.
- One set of instructions to paste into your AI, with the clicks for ChatGPT, Claude, Microsoft 365 Copilot, Gemini and Grok
- The agent then walks you through connecting your own data, one source at a time
- A downloadable copy with the flow chart, the rules and the full guide