AI agent for librarians
Library Statistics and Annual Report Agent
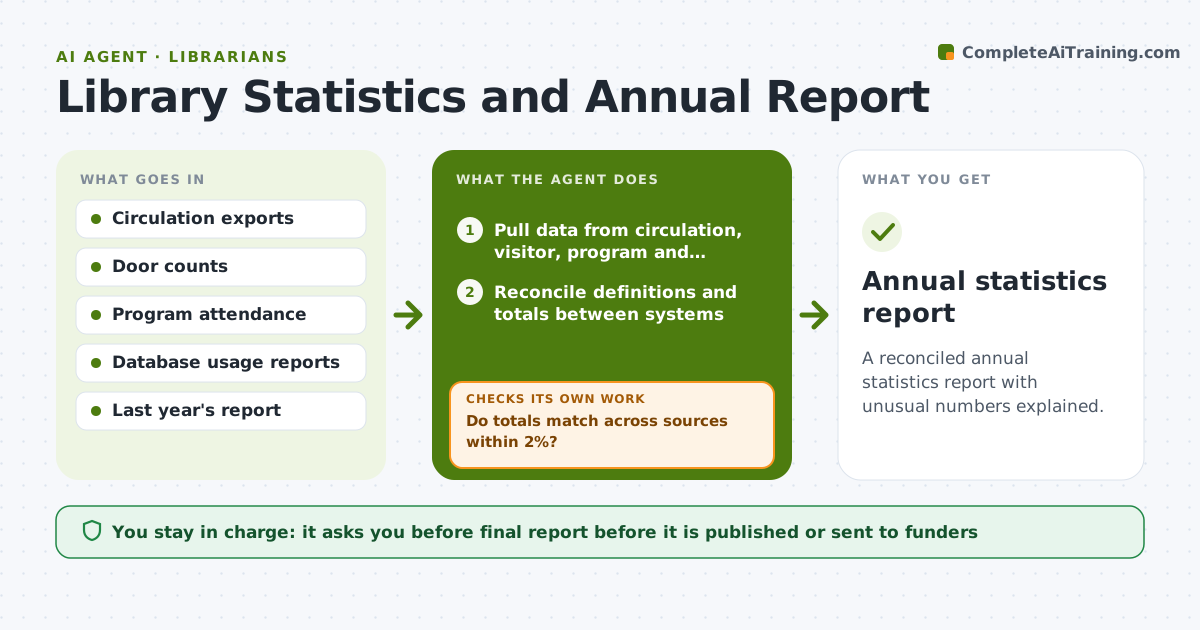
A reconciled annual statistics report with unusual numbers explained.
What it does
Annual statistics take weeks because circulation sits in one system, visitor counts in another and database usage in a third. This agent pulls circulation, visitor, program and database usage figures and reconciles mismatches between systems, such as a different count of active users. It checks each figure against last year and flags swings above your threshold. When a number moves sharply, it asks staff for the reason and records the answer instead of guessing. Once totals match and every swing has an explanation, it drafts the report tables and highlights. Edge case: a branch closure for renovation explains a 30% fall in visits, so the agent adds a note beside the figure. The director approves the report before it goes to the board or funders.
How it works
Follow the arrows from top to bottom. The orange dashed arrow is the loop: when a check fails, the agent goes back and tries again.
Read the steps as a list
- Reporting period closes
- Pull data from circulation, visitor, program and database sources
- Reconcile definitions and totals between systems
- Do totals match across sources within 2%?If not: list the differences and ask staff which source is right. Back to step 3.
- Compare each figure with last year
- Is every swing over 10% explained?If not: ask staff for the reason and record it. Back to step 4.
- Draft report tables and highlights
- Director approves the reportThe agent waits here for your OK.
- Annual statistics report
How it decides
It flags any figure that differs more than 10% from last year or between systems, asks staff, and records the explanation.
- Flag any year-over-year change above 10%.
- Use the source of record for each metric.
- Record every assumption in a notes column.
- Do not estimate missing months silently.
Make it yours
Every agent is a starting point. You choose these settings for your own situation.
- Variance threshold (default 10%)
- Metrics included
- Source of record
- Report format
- Reporting period
What keeps you in control
It always asks you first
- Final report before it is published or sent to funders
Hard limits
- Do not estimate missing data without a note.
- Do not send the report to funders.
It stops when
- Done: all numbers reconciled and the director approved
- Stop: a data source is missing, so the agent marks the gap
Set it up
We guide you through the set-up, step by step
Members get the full set-up guide for this agent. No technical skills needed: you copy, paste and upload.
- One set of instructions to paste into your AI, with the clicks for ChatGPT, Claude, Microsoft 365 Copilot, Gemini and Grok
- The agent then walks you through connecting your own data, one source at a time
- A downloadable copy with the flow chart, the rules and the full guide