AI agent for insurance actuaries
Rate Indication Agent
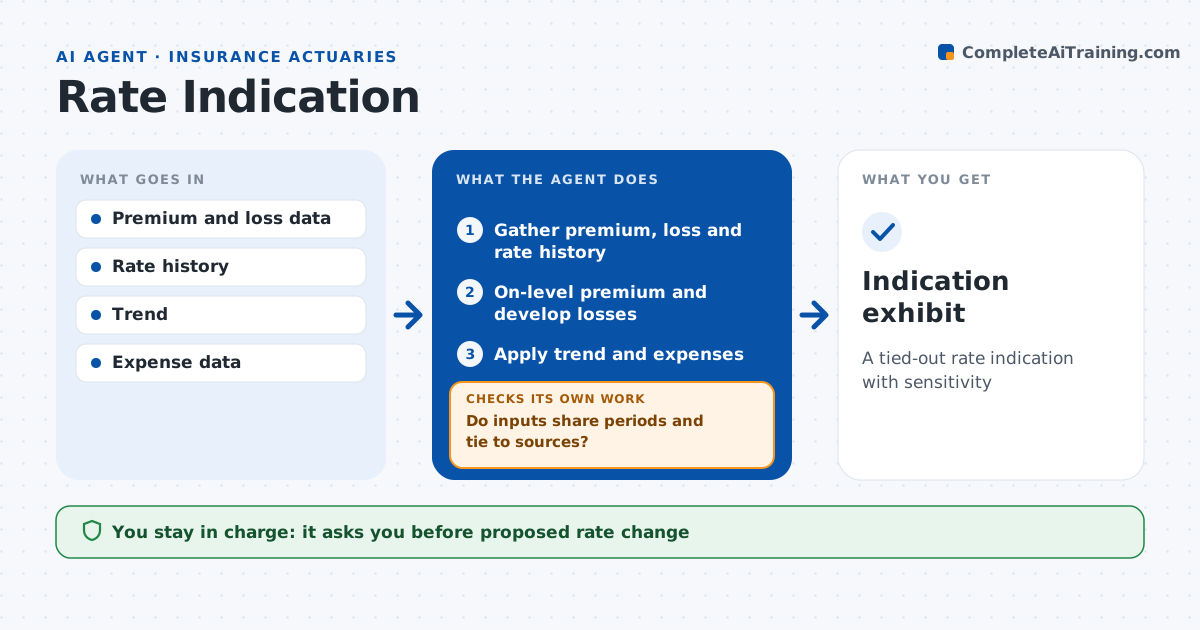
A tied-out rate indication with sensitivity
What it does
Rate indications go wrong when inputs come from different periods or do not tie to source reports. For each line and state due for review, this agent builds the indication. It gathers earned premium, losses, development, trend and expense data, brings premium to current rate level, develops and trends losses, and calculates the indicated change. It then checks that every input uses the same experience period and ties to source reports. If not, it pulls the right data and recalculates. Where credibility is low, it blends with the complement. It runs sensitivity to trend and development choices. It drafts the indication exhibit. The actuary decides the proposed rate. Edge case: a rate change took effect mid-year, so the agent uses the parallelogram method for on-leveling.
How it works
Follow the arrows from top to bottom. The orange dashed arrow is the loop: when a check fails, the agent goes back and tries again.
Read the steps as a list
- Review scheduled
- Gather premium, loss and rate history
- On-level premium and develop losses
- Apply trend and expenses
- Do inputs share periods and tie to sources?If not: pull correct data and recalculate. Back to step 2.
- Run sensitivity
- Actuary decides proposed rateThe agent waits here for your OK.
- Indication exhibit
How it decides
It follows the standard loss ratio method and checks inputs share periods and tie to sources.
- Mid-year rate change: parallelogram method
- Credibility below full: blend with complement
- Trend range sensitivity +/- 1 point
Make it yours
Every agent is a starting point. You choose these settings for your own situation.
- Method
- Experience period
- Sensitivity range
- Exhibit format
What keeps you in control
It always asks you first
- Proposed rate change
- Filing support
Hard limits
- Never files rates
- Never picks the final change
It stops when
- Done: exhibit ready
- Stop: data missing
Set it up
We guide you through the set-up, step by step
Members get the full set-up guide for this agent. No technical skills needed: you copy, paste and upload.
- One set of instructions to paste into your AI, with the clicks for ChatGPT, Claude, Microsoft 365 Copilot, Gemini and Grok
- The agent then walks you through connecting your own data, one source at a time
- A downloadable copy with the flow chart, the rules and the full guide