AI agent for portfolio managers
Sector Price Pressure Monitor Agent
Give early, evidence-based alerts on sectors facing price or margin pressure.
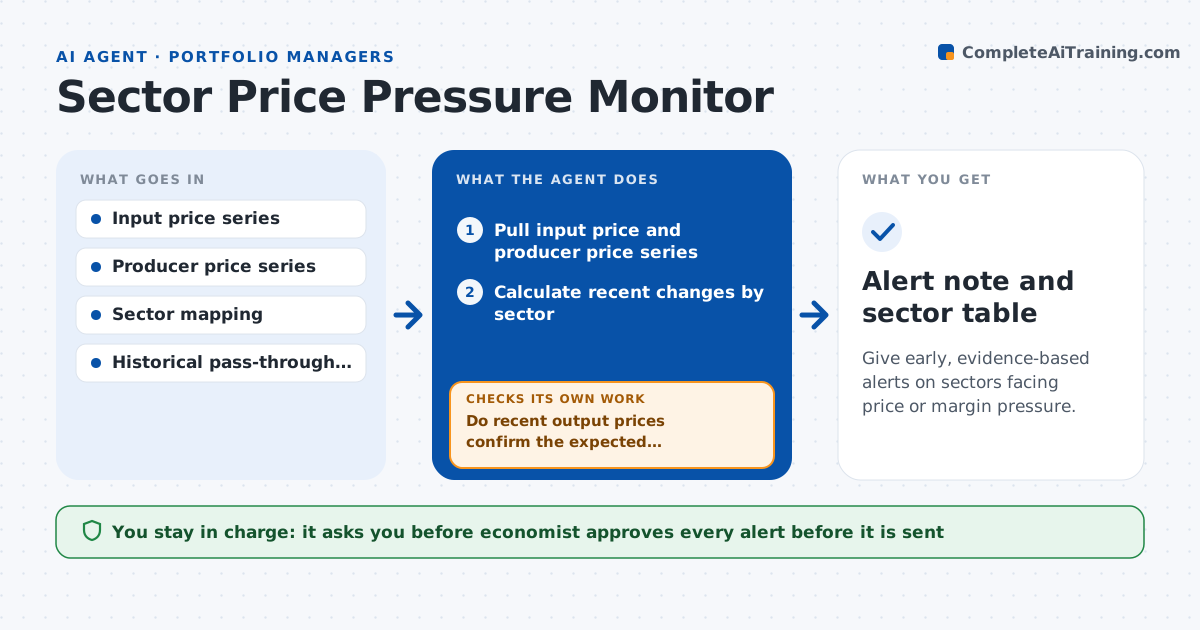
What it does
When an input like steel or freight jumps, it takes weeks to find out which sectors will pass costs on and which will absorb them. This agent tracks input price series for each sector and compares changes with the sector's past pass-through to output prices. It flags sectors where input costs rose faster than output prices historically follow, and estimates the margin pressure. It checks the signal against recent producer price data to see if pass-through has started. If the data does not support the alert, it lowers its confidence and waits. It drafts a short alert note for clients or colleagues. The economist approves what is sent.
How it works
Follow the arrows from top to bottom. The orange dashed arrow is the loop: when a check fails, the agent goes back and tries again.
Read the steps as a list
- Weekly run or large price move
- Pull input price and producer price series
- Calculate recent changes by sector
- Estimate pass-through and lag from history
- Estimate margin pressure for each sector
- Do recent output prices confirm the expected pass-through?If not: lower the confidence, extend the lag window and re-estimate. Back to step 4.
- Rank sectors by pressure and exposure
- Draft the alert note with evidence and chart
- Economist approves what is sentThe agent waits here for your OK.
- Alert note and sector table
How it decides
It estimates margin pressure from the input change, pass-through history and lag, and confirms with recent output price data.
- Flag an input change above 10 percent over 3 months
- Use at least 5 years of history for pass-through
- Mark confidence low if outputs have not moved after the expected lag
- Report a range, never a single point
Make it yours
Every agent is a starting point. You choose these settings for your own situation.
- Sectors and series to track
- Move threshold (default 10 percent over 3 months)
- History window (default 5 years)
- Alert audience and format
What keeps you in control
It always asks you first
- Economist approves every alert before it is sent
Hard limits
- Never gives trade or investment recommendations
- Shows confidence level on every alert
It stops when
- Done: alert approved and sent by a person
- Stop: price series have gaps for the last 2 months
Set it up
We guide you through the set-up, step by step
Members get the full set-up guide for this agent. No technical skills needed: you copy, paste and upload.
- One set of instructions to paste into your AI, with the clicks for ChatGPT, Claude, Microsoft 365 Copilot, Gemini and Grok
- The agent then walks you through connecting your own data, one source at a time
- A downloadable copy with the flow chart, the rules and the full guide