About Chartonomics
Chartonomics is an AI-powered tool designed to simplify the process of creating detailed charts and data visualizations. It enables users to transform complex datasets into clear, visually appealing graphics with ease and efficiency.
Review
This tool offers a streamlined approach to generating charts that can be integrated into reports, presentations, or dashboards. Its intuitive interface and intelligent automation help save time, making data visualization accessible for users with varying levels of technical expertise.
Key Features
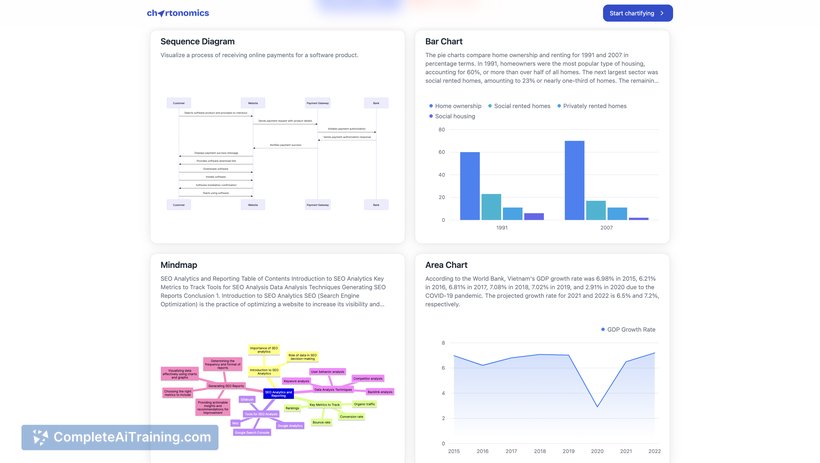
- Automated chart generation based on raw data inputs
- Wide variety of customizable chart types including bar, line, pie, and scatter plots
- Real-time data updating to keep visualizations current
- Export options supporting multiple formats such as PNG, SVG, and PDF
- Integration capabilities with popular data sources and platforms
Pricing and Value
Chartonomics offers several pricing tiers including a free basic plan with limited features and premium subscriptions that unlock advanced functionalities and higher usage limits. The pricing is competitive for the features provided, making it a worthwhile choice for individuals and businesses seeking efficient chart creation without investing in complex software.
Pros
- User-friendly interface suitable for beginners and professionals alike
- Quick chart generation saves valuable time
- Supports a broad range of chart types to cover different needs
- Regular updates and responsive customer support
- Good integration options with common data sources
Cons
- Some advanced customization options are only available in higher-tier plans
- Limited offline functionality as it primarily operates through a web interface
- Occasional learning curve for users unfamiliar with data visualization concepts
Chartonomics is well suited for professionals, educators, and businesses that require quick and clear visual representations of data without the complexity of traditional charting software. It works best for those who value ease of use and efficient workflow in producing high-quality charts.
Open 'Chartonomics' Website
Your membership also unlocks: