About: ToDiagram
ToDiagram is a sophisticated data visualization tool designed to convert intricate data formats such as JSON, YAML, CSV, and XML into interactive diagrams that facilitate analysis and editing. It caters to a diverse range of users, including developers, data analysts, and business professionals, who need to simplify the comprehension of complex datasets. With ToDiagram, users can effortlessly transform raw data into visually appealing and navigable diagrams, enhancing their ability to analyze and derive insights.
Key features include AI-driven functionalities that optimize data representation, seamless cloud storage for easy access and collaboration, and a user-friendly Chrome extension for quick integration into existing workflows. ToDiagram not only streamlines data visualization processes but also promotes collaborative efforts among teams by allowing real-time editing and sharing. Its unique combination of interactivity and ease of use makes it an invaluable asset for anyone seeking to enhance their data-driven decision-making and improve overall productivity in data management tasks.

Review: ToDiagram
Introduction
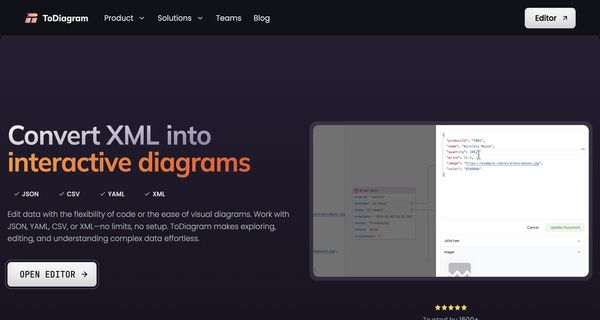
ToDiagram is an intuitive data visualization tool designed to transform complex data structures from formats such as JSON, YAML, CSV, and XML into interactive visual diagrams. It targets developers, analysts, and business professionals who need to quickly convert, analyze, and edit data through a user-friendly visual interface. The tool is especially relevant in today’s data-driven environment, where clear, interactive representations can greatly enhance collaboration and decision-making.
Key Features
ToDiagram stands out in the data visualization space with a variety of core functionalities:
- Multi-format Support: Easily converts JSON, YAML, CSV, and XML into interactive diagrams.
- Interactive Diagrams: Allows for real-time editing, navigation, and visual debugging of complex data structures.
- AI-Powered Capabilities: Utilizes AI to help filter data, restructure content, and even translate fields, streamlining the data analysis process.
- Chrome Extension: Offers seamless integration by enabling users to convert and edit data directly from their browser with a simple right-click.
- Cloud Storage: Facilitates saving and sharing diagrams online, making collaboration across teams more efficient.
- Search and Filter Tools: Equipped with a responsive search bar to quickly locate and highlight specific nodes within diagrams.
Pros and Cons
- Pros:
- Supports a wide range of data formats with no setup required.
- Interactive and user-friendly interface simplifies complex data analysis.
- AI-powered features enhance data processing and editing capabilities.
- Chrome extension integration offers convenience and accessibility.
- Cloud storage and collaboration features aid in team-based workflows.
- Cons:
- Being a browser-based tool, it relies on an active internet connection for optimal performance.
- No native offline functionality is mentioned, which could limit use in low-connectivity environments.
- Mobile support is not highlighted, potentially restricting use to desktop workspaces.
Final Verdict
Overall, ToDiagram offers a robust and versatile solution for anyone who works with complex data structures and needs a streamlined way to visualize and edit information. Its extensive support for multiple data formats, combined with AI-powered enhancements and seamless chrome integration, makes it an excellent choice for developers, analysts, and professional teams. However, users who require offline access or mobile compatibility may find the tool less ideal. If you value an intuitive, collaborative, and efficient approach to data diagramming, ToDiagram is well worth considering.
Open 'ToDiagram' Website
Your membership also unlocks: