AI-Powered Financial Modeling with ChatGPT (Video Course)
Tired of messy data and fragile formulas? This course shows how to build financial models with ChatGPT-5 as your partner,AI handles the grunt work, you focus on strategy. Learn a circular workflow, AI-readable spreadsheets, scenario planning, and validation.
Related Certification: Certification in Building AI-Powered Financial Models

Also includes Access to All:
What You Will Learn
- Implement the circular AI workflow: context loading, structuring, execution, and human review
- Build AI-ready models with separated drivers, named ranges, and chained helper calculations
- Integrate Copilot and code-execution tools to create dynamic scenario dashboards in Excel
- Generate narrative-driven scenarios and map them to concrete driver values for sensitivity testing
- Use AI validation to reconcile actuals, audit business logic, and flag semantic misclassifications
Study Guide
# How to Build Financial Modeling Using ChatGPT-5: The Complete Learning Guide ## Introduction Let me ask you something. When was the last time you built a financial model and actually enjoyed the process? If you're like most finance professionals, the answer is probably "never." You've spent countless hours cleaning messy data, wrestling with broken formulas, and praying that the CFO doesn't ask for another scenario change at 4:55 PM on a Friday. Here's the thing though. That pain isn't inevitable. It's the result of using outdated methods in a world that has fundamentally changed. The way we've been building financial models was designed for a pre-AI era. Linear workflows. Manual data cleaning. Opaque formulas that only the original author could understand. And then we wonder why it takes three weeks to produce a budget that's outdated the moment it's printed. This course is going to change how you think about financial modeling from the ground up. Not by giving you a few clever Excel tricks, but by showing you a completely different way of working. A way where you're not the data janitor, the formula writer, and the error checker all rolled into one. Instead, you become the strategist, the interpreter, and the decision-maker. The AI handles the grunt work. You handle the thinking. We're going to cover the entire journey. How to structure your workflow so AI can actually help you. How to choose the right tools from the chaos of options out there. How to build spreadsheets that both humans and machines can read. How to run scenario planning that doesn't rely on gut feelings. How to integrate AI directly into your Excel environment. And how to use AI to audit your own work before it blows up in your face. By the end of this guide, you'll have a complete framework for building financial models in partnership with AI. Not as a replacement for your judgment, but as an amplifier of it. Let's get started. ## Section 1: Why Traditional Financial Modeling Is Broken Before we can fix something, we need to understand exactly what's broken. And trust me, the traditional approach to financial modeling has some serious structural problems that most of us have just learned to live with. ### The Data Cleaning Nightmare Think about what happens when you start building a model. You're not starting with clean, organized data. You're starting with chaos. Raw reports from multiple sources. Point-of-sale systems that all format things differently. Export files from accounting software that don't quite match up. Spreadsheets sent by regional managers who all have their own way of doing things. Let me give you a concrete example. There's a coffee chain with 50 locations. Nothing huge, but big enough that they need actual financial modeling to run the business. When budget season rolls around, they collect point-of-sale reports from all 50 stores. Now here's where it gets fun. Half the stores use European date formats. The other half use US formats. So 25 stores are reporting "03/05/2024" meaning March 5th, and the other 25 are reporting the same string meaning May 3rd. You can't just merge these files. You can't even trust what you're looking at until every single date has been manually verified and reformatted. That's three hours of your life gone. Just on dates. But wait, there's more. The product names don't match either. One store manager types "cappuccino." Another types "cap." A third types "kappa." They all mean the same thing, but your spreadsheet doesn't know that. So now you're spending another two hours standardizing terminology across 50 different files. And this is before you've even started thinking about the actual model. ### The Fragile Formula Problem Once you finally get the data cleaned, you start building formulas. And this is where traditional modeling really starts to show its age. We build these massive, complex nested formulas that combine IF statements, INDEX-MATCH lookups, OFFSET references, and everything else we can throw in there. The formula works. It produces the right number. But can you explain what it does? Can the person sitting next to you explain it? Can anyone audit it without spending an hour tracing through cell references? Here's what typically happens. The CEO walks in and says, "Hey, I think we should change the price assumption for cappuccinos to $3.75 instead of $3.50." Sounds simple enough. But that $3.50 price is buried somewhere in the middle of a mega formula in cell F42. It's not labeled. It's not in a drivers tab. It's just sitting there as a hard-coded number. So you have to find it, change it, and then pray that nothing else breaks in the process. And something always breaks. Because that same price assumption was referenced in six other formulas across three different tabs. And one of those tabs has a broken link because someone deleted a row last month. And now the whole model is producing garbage numbers and you're working until midnight to fix it. ### The Hidden Logic Problem The worst part about traditional financial models is that they're black boxes. The logic exists only in the modeler's head. If you inherit a model from someone who left the company, you're essentially reverse-engineering their thought process. You're guessing which cells are inputs and which are calculations. You're trying to figure out if that hard-coded number in the formula is a deliberate assumption or just a typo. This is a massive problem for AI adoption. If you can't understand your own model, how can you expect an AI to help you with it? The AI needs to read your formulas, understand your assumptions, and follow your logic. But it can't do that if your model is a chaotic mess of opaque references and hidden values. When a model containing a hidden price assumption of $3.50 was shared with an AI for auditing, the AI flagged it as a "high risk for business logic and auditability." It couldn't tell whether that number was intentional or an error. And honestly, neither could the person who built the model. ### The Linear Workflow Trap Traditional financial modeling follows a linear path. You clean data. You build formulas. You run scenarios. You present results. If anything changes upstream, you have to redo everything downstream. It's like building a house where you have to re-pour the foundation every time the client changes their mind about the kitchen layout. This linear approach is fundamentally incompatible with how business actually works. Business is iterative. Assumptions change. New information comes in. Priorities shift. A good financial model should be able to adapt to these changes without requiring a complete rebuild. ## Section 2: The Circular AI Workflow So what's the alternative? Instead of a linear workflow, we use a circular one. And instead of doing everything manually, we divide the work between AI and deterministic tools based on what each does best. ### The Four Stages of the Circular Workflow The circular workflow consists of four distinct stages. Let me walk you through each one. #### Stage 1: Context Loading This is where you upload raw, unprocessed files directly into a reasoning engine. That could be ChatGPT, Claude, Gemini, or whatever LLM you prefer. The key here is that you do NOT try to clean or fix the data first. You just dump it in there and let the AI figure out what it's looking at. Think of it like handing a box of receipts to a new junior analyst. You don't organize the receipts for them. You give them the box and say, "Figure this out." The AI does the same thing. It assesses the scope of the work, identifies patterns, and prepares to structure the chaos. The only preparation you should do is organizing your files into a single folder and giving them clear, descriptive names. This helps the AI navigate the files and understand what it's working with. #### Stage 2: Structuring Now you prompt the AI to clean and organize the data. This is where the reasoning engine really shines. It can standardize terminology, fix date formats, combine records from multiple sources, and add identifying columns. Here's an example of what a structuring prompt might look like: "You are an accounts assistant. I've attached coffee sales records from three cities. Create a single Excel file combining all records. Add a new column titled 'city' and populate it with abbreviations based on the source file." The AI will take those messy, inconsistent files and produce a clean, structured dataset. It'll replace "cap" and "kappa" with "cappuccino." It'll standardize dates. It'll fix capitalization. It'll organize everything into a logical column structure. One critical thing to remember here: do NOT ask the AI to calculate totals. LLMs are probabilistic, not deterministic. They can make arithmetic errors. Use them for their reasoning and structuring capabilities, not for math. That's what the execution stage is for. The output from this stage can be extracted as a clean CSV file or a Python data frame. Then you move to the next stage. #### Stage 3: Execution The structured data now moves into an execution engine. That could be Excel or Python. This is where deterministic calculations happen. The AI has already resolved all the ambiguities, so your formulas can be simple and straightforward. A simple SUM formula can now calculate item-wise sales without needing to interpret whether "cap" means "cappuccino." The data is clean. The structure is clear. Excel does what Excel does best: precise, predictable math. #### Stage 4: Human Review This is the most critical stage, and the one that most people are tempted to skip. After the AI has structured the data and Excel has executed the calculations, you need to review the output. Not just glance at it, but actually think about what you're seeing. Let me give you an example. Say you've got a well-organized sales sheet now. It's clean, it's structured, and the calculations are correct. But as you're reviewing it, you realize that it would be much more useful if it included a discount column. That way, you could link promotional campaigns to sales volume and see which discounts actually drive business. So you go back to the AI, refine your prompt to include the discount column, and run the cycle again. This time, you get an even better output. And the cycle continues. Each iteration makes the model more sophisticated and more useful. This is the power of the circular workflow. It's not a one-and-done process. It's an iterative loop that improves with each pass. And because the AI handles the heavy lifting of data cleaning and structuring, each iteration takes minutes instead of hours. ### Why This Works The circular workflow works because it plays to the strengths of both AI and traditional tools. AI excels at reasoning, pattern recognition, and language understanding. Excel excels at precise, deterministic calculation. By dividing the work based on these strengths, you get the best of both worlds. You also eliminate the biggest bottleneck in traditional modeling: the data cleaning phase. Instead of spending hours manually standardizing dates and product names, you let the AI do it in seconds. Then you spend your time on what actually matters: analysis, strategy, and decision-making. ## Section 3: Building Your AI-Ready Technology Stack Now that you understand the workflow, let's talk about the tools. The market is absolutely flooded with AI tools right now, and every vendor is claiming their product will revolutionize your finance department. Ignore the hype. Focus on function. ### The Four Categories of AI Tools #### Category 1: The Brain - General LLMs These are your standalone conversational models. ChatGPT, Claude, Gemini. They operate in web browsers and can handle a wide range of tasks. What are they good for? Structure, synthesis, and strategy. They can organize data, combine information from multiple sources, and draft narrative explanations. They're your reasoning engines. What are they NOT good for? Mathematics. Because they're probabilistic, they can make arithmetic errors. Don't ask them to calculate totals or verify numbers. Use them for thinking, not calculating. Here's a practical example. The CFO asks for a board-ready explanation of why the company missed its cold brew target. The reasons are a spike in nitrogen prices and a cooler-than-average June. You have rough bullet points, but you need polished, professional prose that a board of directors will take seriously. You paste your rough notes into an LLM and prompt it: "Draft a concise professional explanation for the variance suitable for a board of directors presentation." In seconds, you have a well-written narrative that addresses the key points in a professional tone. That's the brain doing what it does best. #### Category 2: The Assistant - Co-pilots These are tools embedded within familiar software. Microsoft 365 Copilot in Excel. Gemini in Google Sheets. They're context-aware, meaning they can see the grid you're working in. Co-pilots can generate formulas, format charts, highlight outliers, and answer questions about your data. They don't provide deep strategic insight, but they accelerate execution. You don't have to switch windows or copy-paste data. You just ask the co-pilot to do something, and it does it right there in your spreadsheet. The key advantage of co-pilots is that they eliminate friction. You stay in your flow state. You don't break your concentration to switch between applications. And for finance professionals, that's huge. #### Category 3: The Heavy Lifter - Code Execution Tools These are tools that write and execute code. Python execution in Excel. ChatGPT's Deep Analysis feature. They enable you to perform data science tasks without a computer science degree. Let me give you a concrete example. You need to analyze five years of transaction data across 50 locations. That's millions of rows. Excel will choke on it. It'll take forever to load, and if it doesn't crash, the formulas will be so slow you'll want to cry. But a code execution tool can handle this in seconds. It writes Python code that processes the data, produces clean results, and gives you insights that would be practically impossible to extract manually. #### Category 4: The Specialist - Domain-Specific Platforms These are tools built for specific industries or use cases. They understand the language and logic of their domain. - **Enterprise scalers** like Anaplan and Planful connect HR, operations, and finance through AI-powered planning. They're designed for organizations at 500+ locations where spreadsheets just can't handle the complexity. - **Excel accelerators** like Datarails and Cube preserve spreadsheet flexibility while consolidating data in the cloud. They give you the best of both worlds. - **Vertical agents** are trained on industry-specific language. Wellworth for oil companies. Brick for construction. Argus for real estate. They understand the terminology and logic of their industries better than general chatbots. - **Audit tools** like DataSnipper use AI to verify financials against source documents. They're designed specifically for the audit function. ### The Golden Rule: Data Privacy Before you start using any of these tools, you need to establish a data privacy policy. And I'm not talking about corporate policy documents. I'm talking about a zero-trust mindset. Never put personally identifiable information (PII) into public chat tools. That means no franchise owner addresses, no social security numbers, no legal settlements. These tools are not private. Your data could be used to train models or exposed in a breach. Aggregated sales data is generally acceptable. If you're uploading total revenue by product category, that's probably fine. But if you're uploading customer-level data with names and addresses, you're taking a serious risk. Here's a simple rule: if you wouldn't want it on the front page of a newspaper, don't put it in a public AI tool. ## Section 4: AI-Native Architecture - Building Models AI Can Read Now we're getting to the heart of this course. Most financial models are black boxes. They're full of hard-coded values, opaque references, and logic that exists only in the modeler's head. If a human colleague needs hours to decode such a model, an AI doesn't stand a chance. To build models that AI can actually work with, you need to follow three architectural rules. ### Rule 1: Strict Separation of Inputs and Logic Traditional models embed magic numbers directly into formulas. A cell multiplies daily volume by 3.50, and that 3.50 is the invisible cappuccino price. Only the modeler knows that. And when an AI tries to audit the formula, it can't tell if that number is an assumption or an error. The fix is simple. Create a dedicated drivers tab that houses every assumption. The item name goes in column A, the value goes in column B. Include prices, daily volumes, tax rates, everything. Then rename your original working tab to "calculation" and remove all hard-coded data from it. Every formula should reference the drivers tab. Let me show you what this looks like in practice. Instead of a formula that says `=C5*D5*(1+0.08)` where the 0.08 is the sales tax rate and C5 and D5 are some cells you have to look up, you'd have a formula that says `=CappuccinoPrice*CappuccinoDailyVolume*(1+SalesTax)`. Now the logic is transparent. Anyone can look at the drivers tab and see exactly what assumptions are being used. And an AI can read the formula and understand what it's doing without having to guess. When this principle was applied to a model and shared with an AI for auditing, the AI was able to identify a hidden price assumption that had been embedded in a formula. It flagged it as a high risk for business logic and auditability. That's the kind of insight you can't get from a black box model. ### Rule 2: Replace Grid References with Named Ranges Referencing C5*D5 is meaningless to an AI. It has to guess what those cells represent from row headers that might be merged or offset. Named ranges solve this problem. Here's how you implement it. First, review your column A titles for completeness. If a row says "Cappuccino" but it actually contains the daily volume, change it to "Cappuccino Daily Volume." Do this for all items. Next, select the value cells and press Ctrl+Shift+F3. In the dialog box that appears, choose "Left column" as the name source and click OK. Now your cells have descriptive names. Finally, rewrite your formulas in the calculation tab. Instead of `=C5*D5`, you'd write `=CappuccinoRegularPrice*CappuccinoDailyVolume*(1+SalesTax)`. Why does this matter? Because the formula becomes a sentence. And sentences are the native language of large language models. When you paste that formula into an AI, it can instantly understand the logic. It can even catch accounting nuances. In one instance, an AI was able to read a formula that used named ranges and suggested that the total be renamed to "gross receipts including tax" because it could see that tax was being added. That's a level of understanding that's impossible with grid references. Named ranges make your models readable for both humans and machines. And that's the whole point of AI-native architecture. ### Rule 3: Chain-of-Thought Architecture AI models struggle with mega formulas. You know the ones. Seven lines of nested IF statements combined with INDEX, MATCH, and OFFSET. When you ask an AI to audit such a formula, it might hallucinate because the logic is too dense to unpack. The solution is to break calculations into helper rows or steps. Instead of one massive formula, you create a chain of visible, sequential calculations. Let me walk you through an example. Say you need to calculate net profit after discounts and tax. Instead of cramming everything into one formula, you break it into steps: 1. Row 12: Calculate item-wise gross revenue and sum it. 2. Row 17: Calculate discounts using `=GrossRevenue*DiscountRate`. 3. Row 19: Calculate tax using `=(GrossRevenue-Discounts)*TaxRate`. 4. Bottom row: Net revenue after discounts and tax. Now, when an AI audits the tax calculation, it only needs to examine row 19. It doesn't have to unpack the entire revenue logic. This reduces cognitive load on the reasoning engine and significantly reduces hallucination risk. The same principle applies to human auditors. Your colleagues can follow the breadcrumbs from one step to the next without having to reverse-engineer a monster formula. It's more readable, more maintainable, and more auditable. ### The Payoff: Your Digital Twin When you follow these three rules, your spreadsheet becomes a digital twin of your business logic. It's a model that's both AI-readable and human-auditable. It's a clean, AI-ready environment on which scenarios can be tested. This is the foundation for everything else we're going to cover. Without AI-native architecture, all the AI tools in the world won't help you much. With it, you have a partnership that can transform your financial modeling. ## Section 5: AI-Driven Scenario Planning Scenario planning is where AI really shines. Traditional scenario planning is manual and often based on gut feelings. The CFO asks, "What if coffee bean prices spike due to a frost in Brazil?" and the analyst creates a "Case 2" column and guesses numbers by hand. The AI approach is completely different. It starts with narratives, not numbers. And it follows a three-step process. ### Step 1: Context Injection The first step is to ground the AI in your business's baseline reality. You upload your current driver values and provide business context. Here's an example prompt: "I am modeling the P&L for a coffee chain called Bean and Basket. I have attached the list of key financial drivers and their current baseline values. Memorize the structure along with the following business details: Target market - North American region; Product type - economic coffee." This grounding defines the boundaries of your digital twin. The AI now understands what business it's dealing with, what products are being sold, and what the current financial situation looks like. ### Step 2: Narrative Generation Instead of asking the AI for raw numbers, you assign it a risk-management role. You prompt it to generate realistic scenarios based on macroeconomic risks. Here's an example prompt: "Generate three distinct downside scenarios for Bean and Basket for the upcoming year. Focus on macroeconomic risks specific to the retail coffee industry in the Northeast." The AI will produce coherent economic narratives. And these aren't just random numbers. They're stories that identify causal relationships and correlations that a linear spreadsheet would miss. Let me give you an example of what this might look like: **Scenario A - Labor Cost Step Change**: Wage floors rise faster than the company's ability to raise prices. This causes staff turnover, increased training hours, and reduced transactions as experienced staff leave. **Scenario B - Occupancy and Cost-of-Place Shock**: Rising maintenance costs, utilities, and occupancy costs squeeze seating time and sales. Customers spend less time in stores, which reduces average transaction value. **Scenario C - Coffee Commodity Volatility**: Green coffee costs increase faster than the company's ability to raise prices. The company mixes low-margin drinks to manage costs, which dilutes brand identity and premium positioning. These narratives provide the logic behind the numbers. They tell you WHY the numbers might move, not just WHAT the numbers might be. And that's incredibly valuable for making defensible business decisions. ### Step 3: Driver Mapping Once the AI has generated narratives, you force it to commit to specific numbers. You prompt it to map the narrative to concrete driver values. Here's an example prompt: "These scenarios are great. Now for Scenario A (labor cost step change), tell me exactly how my specific drivers should change from their baseline. Output the new values for relevant drivers in a table format." The AI will respond by placing baseline and scenario values side by side. It will clearly show which drivers change and which remain stable. For example, in the labor cost scenario, labor costs and staff turnover rates would change, but bean bag and milk costs would remain unaffected. This is driver mapping. You're translating qualitative narratives into quantitative changes. And because the AI is forced to commit to specific numbers, you get defensible, auditable assumptions that you can use in your model. ### AI-Directed Sensitivity Analysis The AI can also help you prioritize your sensitivity testing. Instead of guessing which variables matter most, you can ask the AI. Here's an example prompt: "Based on the cost structure of a typical coffee shop and the drivers I gave you, which two variables will have the highest sensitivity impact on net income? Which specific variable should I build a data table for?" In one analysis, the AI identified transaction volume and hourly labor cost as the two variables with the highest impact on net income. This guided the analyst to focus their sensitivity testing on these levers rather than wasting time on variables that wouldn't move the needle. This is strategic insight that would take hours to develop manually. The AI can analyze the cost structure, identify the key drivers, and tell you where to focus your attention. ## Section 6: Integrated Workflows - Eliminating the Toggle Tax There's a hidden cost to using AI tools that most people don't think about. It's called the toggle tax. It's the friction you experience when you switch between Excel and a browser to use AI. You copy inputs, switch windows, wait for the AI to respond, copy the outputs, switch back, and paste the results. Every switch breaks your concentration and slows you down. Integrated workflows bring the reasoning engine directly into the execution engine. You don't have to switch windows. You just ask the AI to do something, and it does it right there in your spreadsheet. ### Using Microsoft Copilot in Excel Let me walk you through a practical example. You have a properly structured drivers tab with named ranges. You want to create a dynamic table showing revenue for three daily volume scenarios (base, upside, downside) for each product. You prompt Copilot: "Use Python to study the drivers tab and then produce a ready-for-insert dynamic table showing revenue based on three daily volume scenarios (base, upside, downside) for each item (cappuccino, espresso, mocha). Calculate the revenue for each item in each scenario by multiplying the respective item price with daily volume. The output dynamic table should have formulas containing accurate named ranges used in the drivers tab." The AI will generate a table with formulas using named ranges. Now, here's where the magic happens. When the AI produces a table with errors, you don't manually fix them. You use iterative prompting to coach the AI. Let's say the espresso row has a `#NAME?` error. You prompt Copilot: "Analyze and recalculate the volume for espresso B3 to D3 because it is giving a name error. Use the same approach as you used for mocha B4 to D4 as that row is accurately calculated and linked." The AI will diagnose the issue. In this case, it might discover a typo in the named range. "espresso" was misspelled as "espresso" in the named range definition. You correct the spelling in both the named cell and the value cell, and the table works perfectly. This is iterative prompting. You're coaching the AI through errors rather than abandoning its work and doing it yourself. It's a skill that takes practice, but it's incredibly powerful. ### Building a Dynamic Scenario Selector Another approach is to build a dashboard with a scenario dropdown. Here's how it works. First, create a scenario selector cell using data validation. The dropdown contains Base, Upside, and Downside options. Next, prompt Copilot: "Write a dynamic formula for this cell. It should look at the drop-down in C2. If C2 is base, use the base case daily volume for the item in B5. If it is upside, use the upside case daily volume for the item in B5." Lock the C2 reference absolutely so it doesn't change as you copy the formula down. Keep the B5 reference relative so it expands correctly when you drag the formula down. Add a revenue formula that multiplies volume by product price from the drivers tab. Now, when you select any scenario from the dropdown, both tables update accordingly. It's a dynamic dashboard that responds instantly to your choices. ### The Benefits Integrated workflows eliminate copy-paste friction. They keep you in the flow. And they produce readable, auditable formulas. When you work with Copilot in Excel, you're not just getting AI assistance. You're getting AI assistance that's context-aware and integrated into your existing workflow. ## Section 7: The AI Validator - Reconciliation and Semantic Review When AI helps you build models fast, it can also help you make mistakes at scale. That's why validation is so important. And here's the good news: AI is excellent at validation. ### Data Reconciliation At month-end, you need to reconcile your forecasts against actuals. This is traditionally a tedious, manual process. You compare numbers, look for variances, and try to figure out what went wrong. AI can automate this. Here's how. Upload two files to the AI: your financial model with sales projections and the raw point-of-sale data export. Then prompt the AI: "Compare the gross revenue for each product by region. Identify any variances larger than $100 and list them in a comparative table showing the specific delta." The AI will scan both files, identify variances, and produce a reconciliation table. In one example, it identified that only Mid-Atlantic Cappuccino breached the threshold. It produced a table showing the volume and revenue delta, and suggested potential root causes and scaling factors. This turns hours of back-and-forth into minutes. The AI doesn't get tired. It doesn't get bored. It doesn't miss rows because it's been staring at spreadsheets for six hours. It just does the work. ### Semantic Validation Here's something that Excel simply cannot do. It can validate math, but it can't validate meaning. It can tell you if a number is correct, but it can't tell you if a transaction is classified in the right account. Let me give you an example. A junior accountant books an espresso machine under "Office Supplies" instead of "Capital Assets." The ledger balances. The math is correct. But the espresso machine is a capital asset that should be depreciated over time, not an office supply that should be expensed immediately. OPEX is overstated, and depreciation is understated. Excel will never catch this. The numbers add up. But an AI knows what an espresso machine is. It knows that espresso machines are capital assets, not office supplies. Here's how you use this. Upload your general ledger detail and prompt the AI: "Review the transaction description column and compare it to the GL category column. Flag any entries that appear to be misclassified based on standard accounting principles." The AI will generate a review table with the transaction description, current GL category, and suggested corrected category. This adds a semantic safety layer that Excel alone cannot provide. ### The Benefits Faster reconciliation. Safer reporting. And a level of quality control that was previously impossible without hiring a team of auditors. ## Section 8: Applied Learning - The Butter Shop Exercise Now let's put everything together with a comprehensive practice exercise. This is designed to reinforce all the concepts we've covered. ### The Scenario You're building a model for Butter Shop, a Nashville bakery selling four products: donuts, croissants, club sandwiches, and cookies. The bakery has two stores and operates in the economic bakery segment. ### Task 1: Create Named Ranges in the Drivers Tab Start by reviewing the column A text in your drivers tab. Make sure the names are sufficiently elaborate. Change "Donut" to "Donut Price" if necessary. Apply the same logic to all products. Select the values and press Ctrl+Shift+F3. Choose "Left column" as the name source and click OK. Verify by clicking each cell and checking that the name appears in the name box. ### Task 2: Create a Calculations Tab Create a new tab named "Calculations." Add headers for daily revenue for all four products. Then use formulas like `=DonutPrice*DonutDailyVolume` to calculate revenue. Select named cells so your formulas read like sentences. ### Task 3: Scenario Planning with AI Open a reasoning engine and prompt it: "I am modeling the P&L for a small bakery called Butter Shop. I have attached a list of key financial drivers and their current baseline values. Memorize this structure along with the following business details: Target market - Nashville; Number of branches - two; Product type - economic bakery items." Attach the drivers tab. Then follow up: "Generate two distinct scenarios for Butter Shop for the sales volume - one upside and one downside - focusing on macro and microeconomic risks specific to the retail bakery industry in Nashville." Review the narratives for credibility before proceeding. Do they make sense? Are the assumptions realistic? If not, ask the AI to revise. Then prompt the AI to commit to concrete numbers: "Tell me exactly how my specific drivers should change from baseline. Output new values in a table." Insert the scenarios into your driver sheet. ### Task 4: AI in the Spreadsheet Environment Use Copilot in Excel to calculate product-wise daily revenue for each scenario. You can use either the table generation approach or the scenario selector approach. Generate a chart for revenue calculations across scenarios. ### Success Criteria Named ranges work throughout. Formulas are readable sentences. Scenarios trace to coherent economic narratives. The dashboard and charts update dynamically when you change scenarios. If you can complete this exercise successfully, you've mastered the core concepts of AI-assisted financial modeling. ## Conclusion Let me leave you with some final thoughts. The way we've been building financial models is fundamentally broken. Linear workflows, manual data cleaning, opaque formulas, and hidden logic. It's slow, error-prone, and it doesn't leverage the tools we have available. The AI-assisted approach changes everything. It replaces the linear workflow with a circular one. Context loading, structuring, execution, human review. It divides the work between AI and deterministic tools based on what each does best. AI handles reasoning, cleaning, and narrative generation. Excel or Python handles precise calculation. The principles of AI-native architecture make this possible. Separating inputs from logic. Using named ranges instead of grid references. Breaking mega formulas into sequential steps. These rules make your models readable by both humans and machines. They turn your spreadsheet into a digital twin of your business logic. Scenario planning becomes a strategic exercise rather than a guessing game. You start with narratives, not numbers. You inject context, generate realistic scenarios, and map them to specific driver values. The AI helps you identify which variables matter most for sensitivity analysis. Integrated workflows eliminate the toggle tax. You bring the reasoning engine directly into the spreadsheet. You use iterative prompting to coach the AI through errors. You build dynamic dashboards that respond instantly to your choices. And AI validation keeps you safe. The AI can reconcile forecasts against actuals, identify variances, and flag misclassified transactions. It adds a semantic safety layer that Excel alone cannot provide. The future of financial modeling is not about replacing human judgment. It's about augmenting it with tools that amplify creativity, accuracy, and speed. The finance professional's role evolves from manual data wrangling to high-level analysis, strategy, and decision-making. So here's my challenge to you. Take what you've learned and apply it. Reorganize your spreadsheets to separate assumptions from calculations. Implement named ranges. Break down your complex formulas. Start using AI for scenario generation and validation. Build the Butter Shop exercise and make it your own. The tools are available. The framework is clear. The only thing left is for you to start. Your future self, the one who isn't spending hours cleaning data and fixing broken formulas, will thank you.Frequently Asked Questions
What is this FAQ section designed to answer?
This FAQ addresses the practical questions that arise when finance professionals begin integrating AI into their financial modeling workflows. It covers the fundamental shift from linear to circular modeling processes, how to structure spreadsheets that AI tools can actually read, ways to use AI for scenario planning and validation, and the critical guardrails around data privacy. The questions progress from basic concepts to advanced implementation techniques, giving you a complete reference whether you are just starting or looking to refine your existing AI-assisted modeling practice. Each answer is designed to be immediately actionable, drawing on real-world finance scenarios like multi-location retail chains, monthly close processes, and board-level reporting.
Fundamental Concepts and Workflows
What is an AI-assisted financial modeling workflow, and how does it differ from traditional modeling?
A traditional financial modeling workflow is typically linear and manual. It begins with raw data collection and extensive cleaning (e.g., standardizing date formats, correcting product names), which consumes significant time. This is followed by building models with complex formulas, which are often difficult to audit. Any change in an assumption (like a price change from the CEO) can trigger a complete rework, forcing the analyst back to the data-cleaning stage.
In contrast, an AI-assisted workflow is circular and iterative. It leverages AI's reasoning power for data structuring and initial analysis, allowing professionals to tackle the unstructured, chaotic data directly. This approach speeds up data cleaning through natural language prompts, reduces the need for complex nested formulas, and allows for rapid iteration on scenarios without starting over. It fundamentally shifts the finance professional's role from data entry and manual formula-writing to strategic analysis and review.
What are the four key steps in the AI-assisted financial modeling workflow?
The AI workflow is a circular, four-step process designed to create a highly efficient and iterative loop:
1. Context Loading: This is the initial phase where the raw, uncleaned files are uploaded directly into a general-purpose LLM (like ChatGPT or Claude). No effort is made to fix the data first. The goal is to hand the "box of receipts" to the AI and allow it to assess the full scope of the work before any structuring begins.
2. Structuring: This is where the AI acts as an accounts assistant. The user provides detailed prompts to clean and standardize the uploaded data. This includes combining files, standardizing naming conventions (e.g., fixing variations like "cappuccino" vs. "cap"), and formatting dates. The AI's reasoning power is used to bring consistency to the raw data.
3. Execution: Once the data is clean and structured, it is moved to an "execution engine" like Microsoft Excel or Python. This is the stage for deterministic mathematical operations, such as calculating sums, margins, and variances. Because the data is clean and well-structured, formulas remain simple, and the spreadsheet does what it does best: precise, reliable calculations.
4. Human Review: This is considered the most critical step. A human reviews the output to assess the results, identify opportunities for deeper analysis, and provide the AI with additional context or information. This might involve adding a new data column, refining a scenario, or adjusting an assumption. The cycle then begins again, immediately re-running the entire process with the new information.
Why is a circular workflow better than a linear one for financial modeling?
Linear workflows assume that once you complete a step, you never revisit it. In practice, that assumption fails constantly. A price change from leadership, a new data source, or a discovered data quality issue forces you back to earlier stages. The circular workflow acknowledges this reality and makes iteration cheap.
When you finish the human review stage and decide to add a discount column or adjust a driver, the AI can re-run the entire data structuring and execution cycle in seconds. You do not need to manually reclean data or rebuild formulas. The circular loop also builds institutional knowledge,each pass through the cycle refines the prompts and the model structure, making the next iteration faster and more accurate. This is particularly valuable during budget season when multiple stakeholders request changes simultaneously.
What are the four categories of tools in a modern financial AI tech stack?
Modern financial teams can organize AI tools into four distinct functional categories, focusing on the role each plays rather than on a specific brand:
1. The Brain (General LLMs): These are conversational models like ChatGPT, Claude, or Gemini. They are not used for math but for structuring information, synthesizing narratives, and strategizing. For example, drafting a professional explanation for a variance in a board presentation based on raw notes.
2. The Assistant (Co-pilots): These tools are integrated directly into existing software, such as Microsoft 365 Copilot or Gemini in Google Sheets. They have context awareness, allowing them to see a grid and generate formulas or charts based on user prompts without breaking the workflow.
3. The Heavy Lifter (Code Executors): These tools write and execute code, like Python via Jupyter Notebooks or ChatGPT's Advanced Data Analysis. They are crucial for handling complex data analysis at scale that traditional spreadsheets cannot process. They enable users to perform data science tasks without a computer science degree.
4. The Specialist (Vertical SaaS): These are specialized platforms built for specific industries or functions. This category includes enterprise-scale planning tools like Anaplan, Excel accelerators like Data Rails, and vertical agents like Argus for real estate or Wellworth for oil companies. They are trained on industry-specific language and provide tailored functionality.
How do I know which AI tool category to use for a specific task?
The decision depends on the nature of the task. Ask yourself: Is this task about reasoning, integration, heavy computation, or domain specificity?
If you need to interpret messy data, generate narratives for board presentations, or brainstorm scenarios, use a general LLM,the Brain. If you are working inside Excel or Google Sheets and need a formula generated or a chart formatted without leaving the application, use a Co-pilot. If you are analyzing years of transaction data across hundreds of locations and Excel keeps freezing, switch to a Heavy Lifter like Python execution. If you are in a specialized industry like real estate or oil and gas, a Specialist tool trained on that industry's language will outperform a general chatbot for domain-specific tasks like lease analysis or reserve estimation.
A practical approach is to start with the simplest tool that can handle the task. Reach for a Specialist only when general tools prove insufficient.
AI-Native Architecture in Spreadsheets
What is "AI-native architecture" for spreadsheets?
AI-native architecture refers to how a financial model is structured to ensure it is easily readable by AI tools. Traditional "black box" models are filled with hard-coded inputs, hidden formulas, and ambiguous grid references (e.g., C5*D5), making them difficult for both humans and AI to interpret. In contrast, an AI-native architecture involves specific structuring rules that make the model's business logic transparent and easily parseable. This includes strictly separating inputs and logic, using named ranges, and building calculations in a step-by-step manner. By creating an AI-native architecture, the model is transformed into a "digital twin" of the business that AI tools can interpret, query, and manipulate with minimal guessing.
Why is the strict separation of inputs and logic important in an AI-driven model?
Separating inputs and logic involves creating a dedicated "drivers" tab for all assumptions (prices, volumes, tax rates) and a separate "calculations" tab for all formulas that reference those drivers. This is critical because it serves as a clean, isolated control panel for the AI. Without it, hardcoded values become invisible magic numbers. For instance, a formula like =C4 * 3.50 hides the price of a cappuccino in the formula bar. However, by placing that price in a dedicated driver cell, the model becomes transparent. When the model is shared with a reasoning engine, it gets a clear, unambiguous view of the inputs and calculations, enabling it to build scenarios or audit the logic far more effectively.
How do named ranges improve the readability and functionality of a financial model?
Named ranges replace ambiguous cell references (C4) with descriptive names (Cappuccino_Price). This simple shift has a significant impact on AI readability. As an AI Native model, the formula '=Cappuccino_Price * Cappuccino_Daily_Volume' functions as a sentence, allowing both humans and AI to understand the logic at a glance. This is essential for auditing and debugging. When formulas are essentially sentences, it becomes easy to hand them to an LLM for error detection, scenario analysis, or to explain the logic to a reviewer. Rather than being abstract math puzzles, they become transparent logic statements.
What is "chain-of-thought" architecture in spreadsheet modeling?
Chain-of-thought architecture, in the context of spreadsheets, refers to breaking down complex, multi-step calculations into clear, visible "helper rows" rather than writing one nested mega-formula. For example, instead of one formula calculating net profit after discounts and taxes, a model would use multiple rows: one row for gross revenue, one for total discounts, and another for tax. This is based on the principle that AI models function best when they are asked to follow a logical, step-by-step process. By using helper rows, the model avoids including 50 steps of logic in a single cell. It makes the task easier for a co-pilot to audit or recalculate each step in the chain, reduces the cognitive load on the reasoning engine, and makes the entire calculation less susceptible to errors and hallucinations.
How do I create named ranges in Excel specifically for AI integration?
Creating named ranges for AI integration follows a simple process but requires attention to naming conventions. First, review the labels in column A of your drivers tab. Make them descriptive,change "Cappuccino" to "Cappuccino_Daily_Volume" so the name carries meaning. Select the value cells alongside their labels, press Ctrl + Shift + F3, choose "Left column" as the name source, and click OK.
For AI compatibility, follow these naming rules: use full descriptive names instead of abbreviations, use underscores or camelCase instead of spaces, and avoid Excel's reserved words. When writing formulas, use named ranges only for absolute references that must stay fixed. Keep relative references (like a product name in column B) relative so formulas expand correctly when copied down. This distinction prevents errors when your model grows.
Certification
About the Certification
Become certified in AI-Powered Financial Modeling with ChatGPT. You'll build resilient, AI-readable financial models, run scenario planning, and validate outputs,turning messy data into strategic decisions.
Official Certification
Upon successful completion of the "Certification in Building AI-Powered Financial Models", you will receive a verifiable digital certificate. This certificate demonstrates your expertise in the subject matter covered in this course.
Benefits of Certification
- Enhance your professional credibility and stand out in the job market.
- Validate your skills and knowledge in cutting-edge AI technologies.
- Unlock new career opportunities in the rapidly growing AI field.
- Share your achievement on your resume, LinkedIn, and other professional platforms.
How to complete your certification successfully?
To earn your certification, you’ll need to complete all video lessons, study the guide carefully, and review the FAQ. After that, you’ll be prepared to pass the certification requirements.
Other AI Video Courses
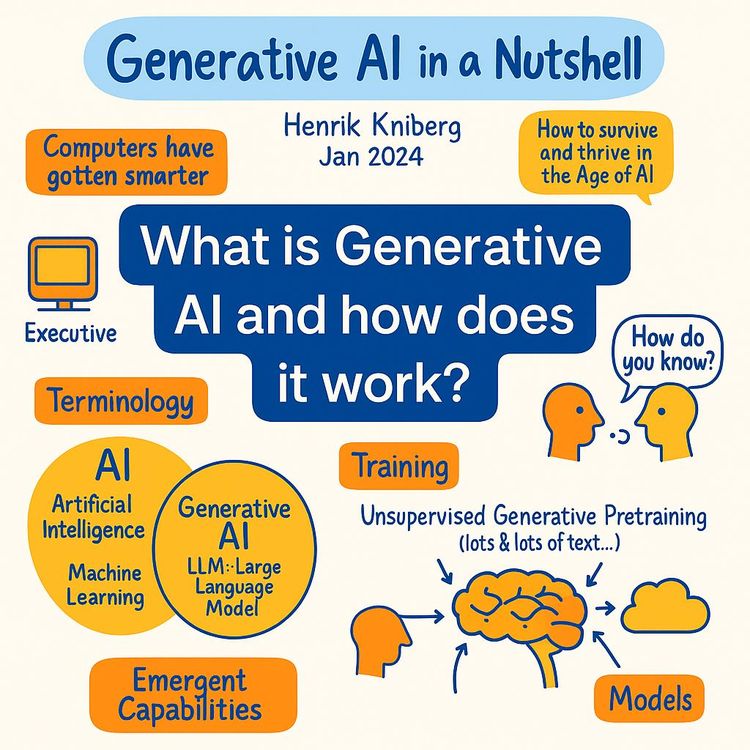
Video Course: What is Generative AI and how does it work?

Video Course: How to Use ChatGPT from Beginner to Professional

Video Course: How to Use Google Gemini for Google Workspace to Boost Productivity

Video Course: How to Use Claude 3.7 AI - Tips for Beginners!

Video Course: ChatGPT for Data Analytics: Full Course - from Beginners to Professional

Video Course: Generating Images and photos With ChatGPT?

Video Course: Generating Images & Photo's with MidJourney

Video Course: Generating Design's with Microsoft Designer and AI

Video Course: Generating Design's with Canva.com and AI
Join 20,000+ Professionals, Using AI to transform their Careers
Join professionals who didn’t just adapt, they thrived. You can too, with AI training designed for your job.