Build & Govern AI: Fix Bias and Unequal Errors (Video Course)
Watch me build and govern an AI system from scratch. We'll predict employee attrition, uncover hidden biases, and tackle unequal error rates. You'll learn to audit models, make hard trade-offs, and build systems that work fairly.
Related Certification: Certification in Building and Governing Equitable AI
Also includes Access to All:
What You Will Learn
- Define operational fairness and set organizational "fair enough" thresholds
- Measure unequal error rates with confusion matrices and interpret group gaps
- Diagnose root causes: underrepresentation, majority dominance, noisy inputs, and biased labels
- Design, test, and document bias mitigation strategies and trade-offs
- Establish governance: audits, monitoring dashboards, decision documentation, and AI literacy
Study Guide
Alright, let's get into it. This is the part where we stop talking about AI in the abstract and get our hands dirty. We're building a system, and we're going to watch it fail in interesting, predictable, and completely fixable ways. This isn't just about writing code or feeding data into a black box. It's about the entire lifecycle,the decisions, the trade-offs, the documentation, and the governance that separates a dangerous toy from a responsible tool. This guide is your blueprint for that journey. We're going to take a specific, high-stakes use case,predicting employee attrition,and walk through the entire process, from defining the problem to understanding the messy reality of the data, to uncovering the hidden biases that can derail everything. The core of this lesson is a concept that sounds academic but has very real, human consequences: unequal error rates. We'll break down what that means, why it happens, and how to spot it. We'll look at real-world examples where things went wrong, and we'll build a framework for governing these systems so you're not just building something that works, but building something that works *fairly*. By the end of this, you'll have the vocabulary and the mental model to not only build an AI system but to audit it, challenge it, and ensure it serves everyone it touches equitably. Let's start from the ground floor.Laying the Foundation: What is Fairness in AI, Really?
Before we can talk about bias, we have to talk about fairness. It's a word we throw around a lot, but in the context of AI, it needs a concrete, operational definition. We can't just say "the system should be fair." We need to define what that means in measurable terms.At its core, fairness in AI means we want equitable outcomes across groups. Regardless of a person's race, ethnicity, gender, age, or any other protected characteristic, the results generated by our system should be broadly similar. We're not talking about perfect parity,where every single group has exactly the same outcome. That's an ideal that's rarely, if ever, achievable in the messy world of human data. The realistic goal is to close the gap between groups to a degree that satisfies our organizational and regulatory expectations.
Here's the critical part that often gets missed: **the threshold for what constitutes "fair enough" is an organizational decision, not just a technical one.** It's a conversation that needs to happen between governance professionals, data scientists, machine learning engineers, and leadership. Let's say we have a model that's used for hiring. If the model is slightly less accurate for a particular ethnic group, is that acceptable? What if the gap is 5%? What about 15%? There's no universal answer. The organization has to decide what level of disparity it's willing to accept, document that decision, and be prepared to defend it to regulators.And it gets even trickier. In many cases, we have multiple protected groups to consider. You might find that a mitigation strategy that closes the gap for one group,say, based on age,actually widens the gap for another, like gender. This is a classic trade-off. The organization must then decide whether to prioritize closing the largest gap, attempting to achieve some level of parity across all groups, or pursuing another defined objective. There's no way to optimize for everything at once. This is a governance decision, not a math problem.
Now, let's talk about a concept that trips up a lot of people: proxies. A proxy is a feature that stands in for another variable, often a protected one. This is how bias sneaks in even when you think you've removed it.Let's say we're building a resume-screening tool. We know we can't use gender as an input, so we simply don't include a "gender" column in our dataset. Problem solved, right? Wrong. The model is a pattern-finding machine. It will find other features that correlate strongly with gender and use those as a stand-in. A gap in a resume for maternity leave might be a proxy for gender. Participation in certain extracurricular activities, like ballet or specific sports, can be a proxy. Attending a women's college is another. The model doesn't know what these things mean; it just sees a statistical correlation. It learns to penalize resumes that contain these signals, effectively recreating the gender bias we tried to remove.
This isn't limited to gender. Think about age. In our attrition dataset, we might have features like "total working years," "job level," and "length of tenure." These are all strongly correlated with age. If we remove the "age" column, the model can still reconstruct an age-based signal from these other features. Similarly, "zip code" is a notorious proxy for race and socioeconomic status. The point is, **removing a protected characteristic from a dataset does not remove the bias.** The bias is woven into the fabric of the data through these correlated features.The Core Problem: Understanding Unequal Error Rates
So, how do we actually measure this bias? This is where the concept of unequal error rates comes in. It's the primary, measurable mechanism through which models create discriminatory outcomes. But to understand it, we first need to understand how we evaluate a model's predictions. We use a tool called a confusion matrix. It's a simple 2x2 table that compares what the model predicted against what actually happened. It might sound basic, but it's the foundation for everything we're about to do.Imagine we're building a model to predict if someone is pregnant. The four outcomes are:
- **True Positive (TP):** The model predicts "pregnant," and the person is, in fact, pregnant. The prediction was correct. - **True Negative (TN):** The model predicts "not pregnant," and the person is not pregnant. The prediction was correct. - **False Positive (FP):** The model predicts "pregnant," but the person is not. This is a false alarm. - **False Negative (FN):** The model predicts "not pregnant," but the person is pregnant. This is a miss. The adjectives "true" and "false" describe reality,whether the prediction was correct. The nouns "positive" and "negative" describe the model's prediction. So, a false negative means the model said "negative" (not pregnant), but that was false because the person actually was pregnant. Now, let's bring this back to our talent attrition system. Our model is predicting whether an employee will leave the company. In this context: - A **false positive** would be predicting an employee will leave, but they actually stay. We'd waste resources on an intervention for someone who wasn't a risk. - A **false negative** would be predicting an employee will stay, but they actually leave. We'd miss a chance to retain a valuable employee. Both are errors, but they have different consequences. The problem arises when these errors don't affect all groups equally. That's the unequal error rate.Let's look at our attrition data. We have 1,470 employees in our historical dataset, and 237 of them left, which is about 16%. Now, let's say our model does a decent job overall. But when we break down its performance by gender, we see something troubling. Of the women who left, the model missed 55% of them,it predicted they would stay. But of the men who left, the model only missed 30%. That's a 25 percentage point gap in error rates.
What does this mean in the real world? It means the model is disproportionately flagging men as "at risk" and missing women. Consequently, more retention resources,the conversations, the raises, the extra time off,flow to men. Women are 25 percentage points less likely to receive an intervention. This is an unequal opportunity violation with significant legal and ethical exposure. The same issue appears when we look at age. The model missed 70% of leavers aged 50-60. It only missed 30% of leavers aged 18-29. That's a **40 percentage point gap.** The older group is also underrepresented in the dataset,only 173 of the 1,470 employees are in that 50-60 range,which compounds the problem. The model simply doesn't have enough examples to learn their patterns. Now, there's a crucial distinction we need to make here: the base rate versus the error rate. - The **base rate** describes reality. It's the actual frequency of the outcome. In our data, the actual departure rates across gender groups are relatively balanced. Men and women leave at roughly the same rate. - The **error rate** describes the model's performance. It's who the model misses. The error rate reveals the model's systematic failures. This distinction is key. A model can be trained on data with perfectly balanced base rates and still produce wildly unequal error rates. The model isn't reflecting a difference in reality; it's creating one through its own learned patterns. The error rate is what matters for fairness assessments.Why Does This Happen? The Four Causes of Unequal Error Rates
Unequal error rates don't just appear from nowhere. They stem from four primary causes, and often, more than one is at play in a single system. Understanding these causes is the first step to fixing them. **Cause 1: Underrepresentation** This is the most intuitive cause. When a group has too little data in the training set, the model simply doesn't have enough examples to learn the patterns of that group accurately. The result is more errors for that group. This is compounded when the group is underrepresented in both the overall dataset and the outcome class,like our older employees who are also leavers. They're a small group to begin with, and the specific behavior we're trying to predict (leaving) is rare within that group.A famous example of this is the Gender Shades study. Researchers tested commercial face classification systems from IBM, Microsoft, and Face++. They found that the error rate for lighter-skinned men was a tiny 0.8%. But for darker-skinned women, the error rate was a staggering 34.7%. The investigation revealed that darker-skinned women were significantly underrepresented in the training and benchmark datasets. The systems simply hadn't been exposed to enough examples of these faces to learn them accurately.
**Cause 2: Majority Dominates** Machine learning models are typically optimized to maximize aggregate accuracy. They're trying to get the most predictions right overall. When a majority class dominates the dataset, errors on a minority class barely affect that overall accuracy metric.Think back to our attrition dataset. Leavers are only 16% of the population, while stayers are 84%. If the model misclassifies a leaver, it's a drop in the bucket compared to all the stayers it's getting right. The model's optimization process doesn't "care" about that error because it doesn't move the needle on the overall score. The majority class effectively wins the model's attention, and the minority class suffers.
A real-world example comes from **speech recognition.** Researchers tested five commercial systems from Amazon, Apple, Google, IBM, and Microsoft. They found an average word error rate of 35% for Black speakers, compared to 19% for white speakers. The systems were tuned to perform well on the dominant demographic in their training data, which resulted in nearly double the error rate for Black users. **Cause 3: Less Informative or Poorly Measured Inputs** Sometimes, the problem isn't the model; it's the data we're feeding it. For certain groups, the raw signals captured as input might be weaker, noisier, or simply less accurate. If the input data is poorly measured for a group, the model's predictions for that group will be weaker.Consider the case of pulse oximeters. These are the little finger-clip devices that measure blood oxygen levels. Studies have shown that these devices are less accurate in individuals with darker skin tones, often overestimating their oxygen levels. This could lead to missing dangerously low oxygen levels. Now, this is a medical device problem, not a machine learning algorithm problem. But if you take that poorly measured data and use it to train an AI system, the model will learn from that inaccuracy. The bias in the input data becomes a bias in the model's output.
**Cause 4: Biased Labels** This is perhaps the most insidious cause. The model is trained to reproduce a target variable that already encodes past human biases. The model isn't creating bias; it's just faithfully copying the bias that's in the labels it was given.The classic example is Amazon's resume screening model. They trained a model on ten years of historical resumes from successful candidates. Because the tech industry has historically been male-dominated, the vast majority of those resumes came from men. The model learned patterns from that data,not just explicit things, but proxies like the types of sports and extracurricular activities women typically participate in, or the names of colleges women often attend. It learned to systematically downgrade resumes from women. The model was ultimately scrapped, but it's a powerful illustration of how historical bias becomes encoded in a model.
Another powerful example is the healthcare cost model. A tool used on 200 million Americans annually used healthcare cost as a stand-in for health need. The logic was that people who spend more on healthcare are sicker and need more attention. However, under-resourced and underserved populations don't spend as much on healthcare,not because they're healthier, but because they face barriers to care. The model consequently under-referred Black patients for additional care, systematically disadvantaging a protected group. The label (cost) was a flawed proxy for the thing we actually cared about (health need).
Governance in Practice: Making Decisions and Documenting Everything
So, we've identified the problem. Now, what do we do about it? This is where governance comes in. It's not just about writing code; it's about the processes and decisions that surround it. First, we need to talk about the **decision threshold.** This is the score at which our model flags an individual for intervention. In our attrition system, the model generates a risk score from 0-100%. But HR doesn't have unlimited resources. Let's say they only have the capacity to conduct 200 retention conversations per quarter. The decision threshold is determined by this resource constraint. If we lower the threshold, we flag more employees, but we also increase our false positives,we're wasting time on people who weren't going to leave. If we raise the threshold, we might miss more true positives,people who are actually at risk. This is a critical point: **bias mitigation for protected classes occurs before model training, while the decision threshold is determined after model validation and testing.** These are separate stages in the lifecycle. We don't fix bias by changing the threshold for different groups; we fix it in the data and the model itself. So, what does a robust governance process look like? It starts with documentation. Regulators and auditors expect to see evidence that you've considered bias deliberately. This means documenting: - The statistical distribution of relevant attributes in your dataset. - The baseline unequal error rates across groups. - The bias mitigation techniques you applied, like class weighting or removing noisy features. - The results of each mitigation attempt. - The residual risk that remains after mitigation.This documentation is crucial because of the trade-offs we discussed earlier. Let's say you apply a mitigation strategy that successfully closes the 40-percentage-point gap for age. But you find that it inadvertently widens the 25-percentage-point gap for gender. This is an organizational decision. You have to decide which is more important and document your reasoning. You can't just ignore it. Regulators expect to see that you've made these trade-offs deliberately and based on legitimate factors.
Finally, governance isn't a one-time event. It's an ongoing process. After the model is deployed, you need to monitor it. You need to track the error rates across protected groups in production. You need to watch for data drift,when the distribution of inputs changes over time, which can subtly alter the model's fairness profile. And you need to provide AI literacy training to the people who act on the model's outputs.For example, if you know the model still under-identifies women at risk of leaving, you need to tell the HR staff that. You need to train them to be aware of that limitation and to incorporate that awareness into their decision-making. The model's output should be one input, not an unexamined verdict.
Your Action Plan: From Theory to Practice
We've covered a lot of ground, and it might feel overwhelming. But all of this knowledge is useless if it doesn't lead to action. Here's a concrete list of steps you can take to apply these principles. 1. **Conduct a Bias Audit.** Start by looking at your existing AI systems,or the one you're about to build,through the lens of the four causes. Is there underrepresentation in your training data? Is the model dominated by a majority class? Are the input data poorly measured for certain groups? Are the labels themselves biased? 2. **Define Fairness Metrics and Thresholds Explicitly.** Before you even start training a model, sit down with your stakeholders and decide what "fair enough" means. Document the rationale for your chosen thresholds and the process for revisiting them. 3. **Develop a Bias Mitigation Testing Protocol.** Don't just try one fix. Evaluate multiple strategies. Test treating all protected groups, treating each group individually, and treating the largest gap. Compare the results and document the residual risk for each approach. 4. **Create a Monitoring Dashboard.** Track error rates across protected groups in production. Set up alerts for data drift and schedule periodic re-evaluations of model fairness. 5. **Implement AI Literacy Training.** Ensure that everyone who acts on model outputs is aware of its known biases and limitations. Give them the tools to make informed decisions. 6. **Integrate Fairness Documentation into the Standard Development Lifecycle.** This shouldn't be an afterthought. It should be a checkpoint at every stage, from data collection through deployment. 7. **Conduct a Proxy Analysis.** For any dataset containing protected characteristics, actively hunt for correlated features that could encode bias, even after the protected features are removed.Conclusion: The Path to Equitable AI
We've gone from the abstract concept of fairness to the concrete mechanics of a confusion matrix, and from the theoretical causes of bias to the real-world failures documented in case studies like Gender Shades and Amazon's resume tool. The central lesson is that algorithmic bias isn't an abstract or peripheral concern. It's a measurable, recurring phenomenon that poses real legal, ethical, and reputational risks. The concept of unequal error rates gives us a concrete, quantifiable framework for understanding and addressing these risks. It allows us to move beyond vague accusations of "bias" and point to specific, actionable problems: "Our model is 40 percentage points less accurate for employees over 50." That's a problem we can tackle. The governance response must be just as systematic. We need explicit fairness definitions, documented mitigation strategies, transparent trade-off analysis, and ongoing monitoring. The talent attrition example shows us that fairness decisions are deeply intertwined with organizational resource decisions, making governance a collaborative effort across technical, operational, and leadership functions. Ultimately, the goal isn't perfect parity,which may be unattainable,but the deliberate, documented reduction of disparity gaps and the transparent communication of residual risk. By understanding the mechanics of unequal error rates and applying the diagnostic and mitigation frameworks we've outlined, you can move toward AI systems that are measurably fairer and more accountable to the populations they serve. This isn't just about compliance. It's about building systems that are worthy of the trust we place in them.Frequently Asked Questions
This FAQ compiles the essential questions and answers for professionals involved in building, deploying, and governing AI systems. It covers bias, unequal error rates, proxy variables, and the governance practices needed to manage these challenges. The questions progress from foundational concepts to advanced implementation considerations, using real-world examples from talent management, healthcare, and commercial technology. Each answer provides practical guidance that can be applied directly to your organization's AI initiatives.Fundamental Concepts
What is "fairness" in the context of AI models?
Fairness in AI refers to the goal of achieving equitable outcomes across different groups. Regardless of race, ethnicity, gender, age, or other protected characteristics, the outcomes produced by an AI system should be close to similar across all groups. Perfect parity,where there is absolutely no difference in error rates or outcomes,is often difficult to achieve in practice. Realistically, organizations should aim to close the gap between groups as much as possible.
The specific threshold that defines "fair enough" is an organizational decision. Governance professionals, data scientists, machine learning engineers, and leadership must discuss and agree upon what level of parity is acceptable. In some cases, closing the gap for one protected group may create a larger gap for another. Organizations may need to prioritize closing the largest gap or making trade-offs based on their values, regulatory requirements, and risk tolerance.
What is a "proxy" in machine learning, and why does it matter for bias?
A proxy is a feature or data element that stands in for another variable due to a strong correlation between them. For example:
Job level and monthly income are highly correlated because higher positions typically pay more.
Total working years and job level are correlated because more experience often leads to higher positions.
Age and total working years are correlated because older individuals have generally worked longer.
Zip code and race are correlated due to historical housing patterns and segregation.
Education institutions and gender may be correlated when certain colleges or activities are disproportionately associated with one gender.
Proxies matter because removing a protected characteristic (like gender, age, or race) from a dataset does not remove the bias. The model can still learn the signal through correlated features. This is known as proxy discrimination. Governance teams must identify and address proxies during data preparation, and in some cases, specialized algorithms can scrub proxy signals from other data elements.
What are protected characteristics and why do they matter in AI governance?
Protected characteristics, also called protected classes, are attributes that cannot legally be used as the basis for discrimination in employment, housing, credit, and other domains. Common examples include age, gender, race, ethnicity, marital status, disability, and religion. The specific list varies by jurisdiction,for instance, marital status is protected under certain state laws like New York law, while age and gender are federally protected.
These characteristics matter because AI models that produce unequal outcomes across protected groups can create legal exposure. If a model's predictions allocate resources unequally,for example, by offering retention conversations and raises to one gender more than another,the organization may face an equal opportunity violation. Governance professionals must ensure that models are evaluated for disparate outcomes across all relevant protected characteristics, not just the ones explicitly included in the dataset.
Reading Model Errors
How should one read the labels "true positive," "true negative," "false positive," and "false negative" from a confusion matrix?
The labels follow a simple grammatical structure: adjective + noun, similar to "blue sky" or "orange balloon."
The adjective (true/false) describes whether the prediction matches reality. The noun (positive/negative) describes the model's prediction.
Read them as:
True positive: Model predicted positive, and that prediction is true (correct).
True negative: Model predicted negative, and that prediction is true (correct).
False positive: Model predicted positive, but that prediction is false (incorrect,the reality is negative).
False negative: Model predicted negative, but that prediction is false (incorrect,the reality is positive).
A common illustrative example uses pregnancy prediction: predicting a woman is pregnant when she is (true positive), predicting a man is not pregnant (true negative), predicting a man is pregnant (false positive), and predicting a visibly pregnant woman is not pregnant (false negative).
What is a confusion matrix and how is it used to evaluate model performance?
A confusion matrix is a table used to evaluate the performance of a classification model. It compares predicted outcomes to actual outcomes and yields four categories: true positive, true negative, false positive, and false negative. The matrix is arranged with the model's predictions on one axis and the actual outcomes on the other.
The confusion matrix is the foundation for calculating error rates, precision, recall, and other performance metrics. For governance purposes, the matrix becomes especially valuable when you break it down by demographic group. By computing the confusion matrix separately for each protected group, you can compare error rates across groups and identify unequal error rates.
In the talent attrition example used throughout this course, the confusion matrix revealed that the model missed 55% of women who left versus 30% of men who left. These numbers come directly from the false negative counts in each group's confusion matrix. Without this group-level breakdown, the model's overall accuracy would have masked the disparity.
Unequal Error Rates
What is an "unequal error rate," and how is it measured?
An unequal error rate describes how often a model is incorrect about each demographic group, and whether that error rate varies significantly between groups. It specifically focuses on false positives and false negatives,the two types of prediction errors.
For example, in a talent attrition system predicting which employees will leave an organization, the model might miss 55% of women who actually left while missing only 30% of men who left. That 25-percentage-point difference is the unequal error rate gap. Unequal error rates are systematic: they indicate that a model performs consistently worse for one group compared to another.
To measure unequal error rates, you calculate the false positive rate and false negative rate for each group separately, then compare the differences between groups. The gap itself is the metric that matters, not just the absolute error rate for any single group.
What is the difference between "base rate" and "error rate"?
Base rate describes reality,the actual distribution of outcomes in the population. For example, if 16% of employees in a historical dataset left the organization, that 16% is the base rate.
Error rate describes the model's performance,how often it is wrong about predictions for each group. The error rate reflects how well the model learned from the data.
The key distinction is that base rate reflects what actually happened, while error rate reflects how well the model performed. Comparing the two reveals where the model is underperforming for specific groups. It is possible for base rates to be similar across groups while error rates differ dramatically. In the talent attrition example, the actual proportion of employees who left was roughly similar across genders, but the model's miss rate was 55% for women versus 30% for men. This divergence between base rate and error rate is exactly what governance teams need to detect.
How do you calculate error rates for different demographic groups?
To calculate error rates by group, you first need to segment your test data by the demographic attribute you want to examine. For each group, you then compute the relevant error metrics from the confusion matrix.
The two most common metrics are the false positive rate and the false negative rate. The false positive rate is calculated as false positives divided by the total number of actual negatives in that group. The false negative rate is calculated as false negatives divided by the total number of actual positives in that group.
For example, if 135 women actually left the organization and the model correctly identified 87 of them, the false negative count is 48. The miss rate is 48 divided by 135, or 55%. You would repeat this calculation for each group and then compare the rates across groups. The difference between the highest and lowest group error rates is your unequal error rate gap. This calculation should be performed during model validation and again during ongoing monitoring.
What are the real-world consequences of unequal error rates in an organizational decision-making system?
Unequal error rates translate directly into unequal allocation of resources and opportunities. In a talent attrition system, for instance, the model's predictions determine which employees receive retention conversations, raises, time off, or other work-life balance interventions.
If the model misses a higher percentage of women who are at risk of leaving, then fewer women receive these retention resources compared to men. This creates a systematic disadvantage for one group and constitutes an equal opportunity violation under employment law. The bias in the model's predictions becomes bias in real-world outcomes,a legal and ethical risk for the organization.
The same pattern applies in other domains. A healthcare algorithm that under-referrals Black patients leads to unequal access to care. A facial recognition system with higher error rates for darker-skinned women can lead to wrongful accusations. In every case, the model's errors don't stay in the model,they become real consequences in people's lives.
How do underrepresentation and small sample sizes contribute to unequal error rates?
Machine learning models learn patterns from data. When a demographic group is underrepresented in a training dataset, the model has fewer examples to learn from and therefore makes more errors on that group. This problem is compounded when the outcome itself is rare.
In the talent attrition example, only 16% of employees were leavers (the minority class). Among leavers, the 50-60 age group represented only 173 out of 1,470 total employees. These older employees were "taxed twice",they belonged to both a rare outcome group and an underrepresented demographic group. The model simply did not have enough exposure to learn their patterns effectively, resulting in a 70% miss rate compared to a 30% miss rate for the 18-29 age group.
This is not a problem that can be solved by simply collecting more data in all cases. Sometimes the data genuinely does not exist at scale for certain groups. In those situations, governance teams must acknowledge the limitation, document it, and consider whether the model should be deployed at all for those groups.
Causes of Unequal Error Rates
What are the four main causes of unequal error rates in AI systems?
The four primary causes are:
1. Underrepresentation: Too little data exists for a particular group, giving the model insufficient examples to learn patterns accurately.
2. Majority dominance: The model optimizes for aggregate accuracy, so errors on minority classes barely affect the overall performance metric and do not prompt adjustments.
3. Less informative or worse-measured inputs: The raw data signal is weaker or noisier for one group, leading to weaker predictions.
4. Biased labels: The model is trained to reproduce a target that encodes past human biases, faithfully replicating those biases in its predictions.
These causes are not mutually exclusive; they can overlap and compound within a single system. For example, a model might suffer from both underrepresentation and biased labels simultaneously. Identifying which causes are at play in your system is the first step toward effective mitigation.
What is the Gender Shades study, and what did it demonstrate?
The Gender Shades study, conducted by researchers testing commercial face classification systems from IBM, Microsoft, and Face++, was a landmark demonstration of underrepresentation.
The error rates were starkly unequal:
Lighter-skinned men: 0.8% error rate
Darker-skinned women: 34.7% error rate
Upon investigating the training and benchmark data, researchers found that darker-skinned women were underrepresented. Because the systems did not have sufficient examples of these faces to learn from, they performed significantly worse for this group. The study demonstrated that underrepresentation in training data produces systematic errors in deployment.
The study also highlighted intersectionality,the idea that bias can compound when someone belongs to multiple marginalized groups. Darker-skinned women faced a far higher error rate than either lighter-skinned women or darker-skinned men, showing that bias analysis must consider combinations of protected characteristics, not just each one in isolation.
How does "majority dominance" affect model performance for minority groups?
When a model learns, it maximizes aggregate accuracy,it tries to be correct as often as possible across the entire dataset. When the model makes an error on a minority class (e.g., the 16% of employees who leave), that error barely moves the overall accuracy metric because the majority class (84% who stay) dominates the calculation.
This means the model has little incentive to adjust its behavior to improve performance on the minority group. The majority "wins" the model's attention, and performance for minority groups remains suboptimal.
A prominent example is racial disparities in automatic speech recognition. Researchers tested five commercial systems from Amazon, Apple, Google, IBM, and Microsoft, finding an average word error rate of 35% for Black speakers versus 19% for white speakers,nearly double the error rate. The systems were tuned to perform well for the majority of speakers in the training data.
What is the pulse oximeter example, and what does it teach about data quality?
Pulse oximeters,the devices that clip onto a finger to measure blood oxygen levels,demonstrate how data collection hardware can produce biased inputs. Research found that these devices overestimated oxygen levels in patients with darker skin tones, missing dangerously low oxygen levels in that population.
The key lesson is that input quality matters before any machine learning algorithm is involved. The medical device itself produced a weaker, noisier signal for one group. When a model is trained on such data, it learns from that degraded signal and produces weaker predictions for that group. This illustrates that poor data measurement is itself a source of unequal error rates.
For governance professionals, this example is a reminder that bias can enter the system at the data collection stage, long before any model is trained. When evaluating a dataset, you should ask not just whether the data exists for all groups, but whether the data was collected with equal quality across all groups.
What are "biased labels," and how do they enter AI systems?
Biased labels occur when the target variable used to train a model encodes past human biases. The model then faithfully reproduces those biases because it learns to predict the target,and the target itself is biased.
The model is not so much "biased" as it is accurately reflecting bias in the labels it was trained on. This is a subtle but important distinction. The model is doing exactly what it was asked to do; the problem is that what it was asked to predict encodes historical discrimination.
Two famous examples illustrate this: Amazon's resume ranking model learned from 10 years of past resumes where successful candidates were overwhelmingly male, and a healthcare system used spending as a stand-in for health need, which disadvantaged patients who could not afford to seek care. In both cases, the labels themselves carried the bias, and the model simply replicated it.
What happened with the Amazon resume ranking model and what lessons does it offer?
Amazon built a resume ranking model using ten years of historical resumes from successful candidates. Because that historical data overwhelmingly represented men as successful candidates, the model learned to penalize resumes containing signals associated with women,such as certain college names, extracurricular activities, or maternity leave gaps.
The model was trained on labels that encoded past hiring decisions, and those decisions reflected historical gender bias. The model faithfully reproduced that bias, penalizing women's resumes even though gender was not an explicit input feature.
The key lesson for governance professionals is that historical data is not neutral. Past decisions carry the biases of their time. When you train a model on historical outcomes, you are training it to replicate those biases. Before using historical labels, you should ask whether the outcomes you are predicting were themselves fair. If they were not, you need a different labeling strategy or a bias mitigation approach that accounts for the biased labels.
How does using healthcare costs as a proxy for health needs create bias?
A widely used health prediction tool relied on annual healthcare spending as a stand-in for health need. The logic was that people who spend more on healthcare must be sicker. However, under-resourced and underserved individuals often spend less because they do not access care at the same rate, even if their health needs are equal or greater.
As a result, the model systematically under-referred Black patients, leading to unequal access to care. The problem was not that the model was intentionally biased, but that the label itself,healthcare spending,was a flawed proxy for the true concept of interest, which was health need.
This example illustrates a critical governance principle: you must examine not just the features used by the model, but the label itself. Ask whether the target variable accurately represents the concept you actually care about. If the label is a proxy for something else, it can introduce bias even when all the features are unbiased.
Bias Mitigation and Governance
What is a decision threshold, and how does it relate to model predictions?
A decision threshold is the numerical cutoff at which a model's output triggers a particular action. For a talent attrition system that produces risk scores from 0 to 100%, the decision threshold determines what score qualifies as "high risk" and flags an employee for intervention.
The threshold is often determined by organizational resource constraints. For example, if HR can only conduct retention conversations with 200 employees per quarter, the threshold is set to flag only the top 200 at-risk employees. If the organization hires more HR staff and can accommodate 300 interviews, the threshold adjusts accordingly.
The threshold can also be set based on the relative costs of false positives versus false negatives. In fraud detection, you might set a higher threshold to minimize false positives and reduce alert fatigue. In medical screening, you might set a lower threshold to minimize false negatives and catch more potential cases. The threshold is a business decision, not a technical one, and it should be documented as part of the governance record.
Can decision thresholds be set differently for different protected groups to reduce bias?
Bias mitigation for protected classes happens before the model is trained, during data preparation. Once the model is trained, validated, and tested, the decision threshold is determined separately,typically based on organizational resource constraints or operational requirements (like minimizing false positives in fraud detection).
These are two distinct stages in the AI development life cycle. The process of bias mitigation and the determination of the decision threshold occur at different points. In practice, adjusting decision thresholds for individual protected groups raises complex fairness questions, including legal considerations, and requires careful documentation and organizational agreement.
If an organization were to set different thresholds for different groups, it would need to justify why that approach is fair and legal. This is a highly sensitive area that requires legal review and clear documentation of the rationale. In most cases, the standard approach is to mitigate bias during training and use a single decision threshold based on operational needs.
What trade-offs arise when attempting to reduce unequal error rates across multiple protected groups?
Organizations rarely achieve perfect parity across all protected groups simultaneously. When bias mitigation is applied to one group, it often creates imbalances for others. For example, closing the error rate gap for age may open a gap for gender.
The governance approach is to:
1. Test multiple bias mitigation strategies (e.g., treating all groups, then treating individual groups).
2. Document the statistical distribution before and after mitigation.
3. Present the results, including residual risk, to decision-makers.
4. Accept that some residual bias may remain and incorporate that knowledge into training for system users.
The important governance principle is that all of this analysis must be documented. When regulators or auditors review the system, they want to see that the organization examined the statistical distribution, tested different mitigation approaches, and made informed decisions about acceptable residual risk.
What should the "target" error rate be for each group?
There is no universal target error rate. The goal is equity,to minimize the gap between groups as much as possible. What constitutes "acceptable" is an organizational decision that should consider:
The regulatory environment governing the protected characteristics involved.
The practical feasibility of achieving closer parity.
Trade-offs across different protected groups.
The specific consequences of errors in the deployment context.
From a governance perspective, the key is not a predetermined error rate but a documented, defensible process for determining what is equitable and maintaining that standard through ongoing monitoring. The organization should be able to explain why a particular gap was deemed acceptable, what alternatives were considered, and how the decision was made.
Why does removing a protected characteristic from a dataset fail to eliminate bias?
Removing a protected characteristic (like age, gender, or race) does not remove bias because the model reconstructs the signal from proxy features. For example, if age is removed from a talent attrition dataset, features like "total working years" remain highly correlated with age (correlation coefficient of 0.68). The model learns this relationship and effectively rebuilds the age signal from available features.
This is why governance professionals must identify proxies during data preparation and use algorithms or transformation techniques to scrub proxy signals where feasible. Simply dropping a column from the dataset is insufficient.
The same principle applies to all protected characteristics. Removing "gender" does not help if the dataset contains features like extracurricular activities, college names, or resume gaps that correlate with gender. Removing "race" does not help if zip code is present. The model will find the signal through whatever correlated features remain.
How does bias mitigation differ from setting decision thresholds in the AI development life cycle?
Bias mitigation occurs during data preparation and model training,before the model is finalized. Techniques include data balancing, assigning class weights so the model gives different importance to different groups when calculating loss, and stripping proxy signals from correlated features.
Decision threshold determination occurs later, after the model is trained, validated, and tested. The threshold is set based on operational requirements,resource constraints (like HR interview capacity) or desired trade-offs between false positives and false negatives (like avoiding alert fatigue in cybersecurity).
These are separate stages with separate considerations. Confusing them can lead to governance errors and inadequate bias management. Bias mitigation shapes how the model learns; the decision threshold shapes how the model's outputs are used. Both are important, but they serve different purposes and occur at different points in the life cycle.
Certification
About the Certification
Get certified in fair AI system design,build attrition models, audit bias and unequal errors, and implement governance that employers can trust for high-stakes, data-driven HR decisions.
Official Certification
Upon successful completion of the "Certification in Building and Governing Equitable AI", you will receive a verifiable digital certificate. This certificate demonstrates your expertise in the subject matter covered in this course.
Benefits of Certification
- Enhance your professional credibility and stand out in the job market.
- Validate your skills and knowledge in cutting-edge AI technologies.
- Unlock new career opportunities in the rapidly growing AI field.
- Share your achievement on your resume, LinkedIn, and other professional platforms.
How to complete your certification successfully?
To earn your certification, you’ll need to complete all video lessons, study the guide carefully, and review the FAQ. After that, you’ll be prepared to pass the certification requirements.
Other AI Video Courses
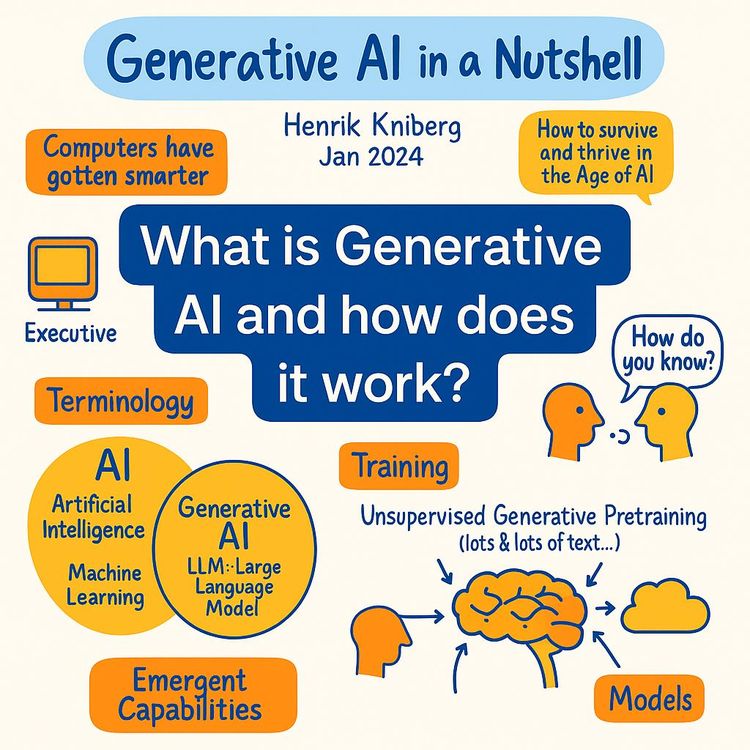
Video Course: What is Generative AI and how does it work?

Video Course: How to Use ChatGPT from Beginner to Professional

Video Course: How to Use Google Gemini for Google Workspace to Boost Productivity

Video Course: How to Use Claude 3.7 AI - Tips for Beginners!

Video Course: ChatGPT for Data Analytics: Full Course - from Beginners to Professional

Video Course: Generating Images and photos With ChatGPT?

Video Course: Generating Images & Photo's with MidJourney

Video Course: Generating Design's with Microsoft Designer and AI

Video Course: Generating Design's with Canva.com and AI
Join 20,000+ Professionals, Using AI to transform their Careers
Join professionals who didn’t just adapt, they thrived. You can too, with AI training designed for your job.