Video Course: AI Foundations Course – Python, Machine Learning, Deep Learning, Data Science
Dive into the world of AI with our 'AI Foundations Course'! Learn Python's crucial role in AI, master machine learning algorithms, and tackle real-world projects. Gain the skills to confidently navigate the AI landscape and elevate your career.
Related Certification: Certification: AI Foundations with Python, Machine Learning & Data Science

Also includes Access to All:
What You Will Learn
- Use Python and libraries: Pandas, NumPy, Scikit-learn, TensorFlow, PyTorch
- Build regression, classification, and clustering models
- Apply linear, logistic, Ridge regularisation, and evaluation metrics
- Develop recommendation systems and ensemble models (Bagging, AdaBoost)
- Perform data preprocessing, visualization, and model deployment basics
Study Guide
Introduction: Unlocking the Power of AI with Python
Welcome to the 'AI Foundations Course – Python, Machine Learning, Deep Learning, Data Science.' This course is your gateway to understanding the transformative power of artificial intelligence (AI) and machine learning (ML). Whether you're a budding data scientist or a business professional looking to harness AI, this course offers a comprehensive exploration of essential concepts, practical implementations, and career insights. You'll learn why Python is indispensable in this field, explore various machine learning algorithms, and understand how to apply these techniques to solve real-world problems. By the end of this course, you'll be equipped with the knowledge and skills to navigate the AI landscape confidently.
Understanding Python's Role in AI and ML
Python is more than just a programming language; it's the backbone of AI and ML development. Its popularity stems from its simplicity and the vast ecosystem of libraries that cater to every aspect of data science and machine learning.
Practical Application: Knowing Python is crucial for implementing theoretical knowledge in a job setting.Key Libraries: The source identifies several essential Python libraries for machine learning:
- Data Manipulation & Analysis: Pandas, NumPy, SciPy
- Classical Machine Learning: Scikit-learn
- Natural Language Processing: NLTK
- Deep Learning: TensorFlow and PyTorch
- Data Visualisation: Matplotlib and Seaborn
Understanding these libraries and how they work together is crucial for anyone aspiring to excel in AI and ML.
Demonstrating ML Competency through Projects
To showcase your machine learning skills, engaging in diverse projects is key. Here are three project types that demonstrate a well-rounded understanding:
- Regression: Build a model to predict a continuous outcome, such as house prices or sales forecasts. This involves training, testing, validating, and optimizing regression models.
- Classification: Create models to classify data into categories, like spam detection or sentiment analysis. Use algorithms like logistic regression and decision trees, and evaluate with metrics such as the F1 score.
- Unsupervised Learning: Use clustering techniques like K-means to group data, such as customer segmentation, demonstrating expertise in unsupervised learning.
Linear Regression and Regularisation Techniques
Linear regression is a foundational concept in machine learning, used to predict a dependent variable based on one or more independent variables.
Ordinary Least Squares (OLS): OLS finds the optimal coefficients by minimizing the sum of squared residuals.Multiple Linear Regression: Extends simple linear regression to models with multiple variables.
Ridge Regression (L2 Regularisation): Adds a penalty term to the loss function to reduce model variance.
Understanding these techniques is crucial for building robust predictive models.
Assumptions of Linear Regression
Linear regression relies on several key assumptions to ensure reliable results:
- Linearity: The relationship between variables is linear.
- Exogeneity: Independent variables are not affected by error terms.
Violating these assumptions can lead to biased results, so it's important to check these before proceeding with analysis.
Implementing Linear Regression in Python
Python's Scikit-learn library makes it easy to perform linear regression. Here's a step-by-step process:
- Importing Libraries: Use NumPy and Matplotlib for computation and visualization.
- Data Organisation: Define your independent and dependent variables.
- Model Instantiation and Training: Use LinearRegression from Scikit-learn to train your model.
- Prediction: Predict outcomes for new data using the trained model.
- Visualisation: Plot the data points and regression line to understand the model's fit.
Logistic Regression for Binary Classification
Logistic regression is used for binary classification problems, predicting the probability of a binary outcome.
- It uses a sigmoid function to map predictions to probabilities.
- A threshold is used to classify data into binary categories.
This technique is useful for problems like spam detection or customer churn prediction.
Advanced Classification Techniques: LDA and Naive Bayes
Linear Discriminant Analysis (LDA) and Naive Bayes classifiers offer advanced methods for classification.
LDA: Finds the best line to separate classes based on features.Naive Bayes: A probabilistic classifier useful for high-dimensional data.
These techniques are valuable for complex classification problems where traditional methods may fall short.
Decision Trees and Ensemble Learning
Decision trees are intuitive models used for both regression and classification tasks.
- Regression: Predict continuous outcomes using DecisionTreeRegressor.
- Classification: Use decision trees for classifying data.
Ensemble techniques like Bagging and AdaBoost enhance model performance by combining multiple models.
Data Analysis and Visualisation with Python
Python's libraries like Pandas and Seaborn are powerful tools for data analysis and visualization.
- Data Loading and Inspection: Use Pandas to load and inspect data.
- Handling Missing Data: Techniques for dealing with missing values.
- Visualisation: Use Matplotlib and Seaborn for insightful data visualizations.
Effective data analysis is crucial for making informed decisions based on data insights.
Causal Analysis with Multiple Linear Regression
Multiple linear regression is used for causal analysis, identifying factors influencing outcomes.
- Problem Definition: Define the problem and relevant variables.
- Data Exploration and Preparation: Prepare data for analysis.
- Training and Evaluation: Train the model and evaluate its performance.
This technique is useful for understanding complex relationships and making predictions based on multiple factors.
Building a Movie Recommendation System
Recommendation systems are a practical application of AI, enhancing user experience by suggesting relevant content.
- Data Source: Use a dataset of movies with features like genre and overview.
- Feature Engineering: Combine features to create a comprehensive descriptor for each movie.
- Vectorization and Similarity Calculation: Use vectorization techniques to calculate similarity between movies.
Building a recommendation system involves understanding user preferences and utilizing machine learning techniques to provide personalized suggestions.
Career Advice and Future of Data Science
Building a successful career in data science involves continuous learning and strategic planning.
- Taking Initiative: Seek out projects and build trust through quality work.
- Networking and Personal Branding: Build a personal brand and connect with the data science community.
- Continuous Learning: Stay updated with the latest trends and technologies.
The future of data science is promising, with increasing demand for skilled professionals to harness the power of AI and automation.
Conclusion: Applying AI Skills Thoughtfully
Congratulations on completing the 'AI Foundations Course – Python, Machine Learning, Deep Learning, Data Science.' You've gained a comprehensive understanding of essential AI concepts and practical skills to implement them. Remember, the key to success in AI is thoughtful application—using these skills to solve real-world problems and drive meaningful change. As you continue your journey in AI, keep exploring, learning, and applying your knowledge to make a positive impact in your field.
Podcast
There'll soon be a podcast available for this course.
Frequently Asked Questions
Welcome to the FAQ section for the 'AI Foundations Course – Python, Machine Learning, Deep Learning, Data Science'. This comprehensive guide is designed to address common questions and provide clarity on various topics covered in the course. Whether you're a beginner or an experienced professional, these FAQs aim to enhance your understanding and application of AI concepts.
Why is Python considered a crucial skill for machine learning?
Python has become a cornerstone in the field of machine learning due to its versatility and extensive ecosystem of libraries. It serves as a universal language for various roles, including software engineers, AI engineers, machine learning engineers, and data scientists. Knowing Python allows professionals to implement theoretical concepts in practical applications, perform descriptive statistics, train various machine learning models (from basic to advanced deep learning), and build AI-powered applications. Its vast collection of libraries, such as Pandas, NumPy, Scikit-learn, SciPy, NLTK (for text data), TensorFlow, and PyTorch (for advanced machine learning and deep learning), significantly enhances productivity and enables the development of sophisticated AI solutions. Furthermore, data visualisation libraries like Matplotlib and Seaborn are essential for understanding and presenting data effectively. A strong foundation in Python, including knowledge of basic data structures and how to utilise these powerful libraries, is therefore indispensable for anyone looking to enter or advance in the field of machine learning.
What kind of practical machine learning projects should someone undertake to demonstrate their skills?
To effectively showcase machine learning abilities, it is recommended to engage in projects that cover different areas of machine learning. For regression tasks, a project could involve training a model (like single linear regression) to predict a continuous outcome, such as comparing the performance of different algorithms using metrics like Root Mean Squared Error (RMSE). This demonstrates an understanding of training, testing, validation, and hyperparameter optimisation for regression models. For classification tasks, building a model to classify emails as spam or not spam using publicly available data is a valuable exercise. This involves training models like logistic regression, decision trees, random forests, or gradient boosting machines, and evaluating their performance using metrics like the F1 score or ROC curve. Finally, for unsupervised learning, a project could focus on clustering customers into different segments (e.g., good, better, best) based on their transaction history using algorithms like K-means, DBSCAN, or hierarchical clustering, followed by an evaluation of the clustering results. Completing these types of projects demonstrates a well-rounded understanding of different machine learning paradigms and the ability to apply them to real-world problems.
What is the core principle behind Ordinary Least Squares (OLS) in linear regression?
Ordinary Least Squares (OLS) is a fundamental technique used in linear regression to estimate the unknown parameters (coefficients and the intercept) of a linear model. The core principle of OLS is to find the line (or hyperplane in the case of multiple independent variables) that best fits the observed data by minimising the sum of the squared differences between the observed values of the dependent variable and the values predicted by the linear function of the independent variables. These squared differences are also known as the squared residuals. In essence, OLS seeks to minimise the total amount of error made by the model in predicting the dependent variable. The estimated parameters obtained through OLS are considered the "best" in the sense that they provide the best fit to the data according to this least squares criterion, under certain assumptions about the data and the error terms.
How does Ridge Regression differ from Ordinary Least Squares (OLS)?
Ridge Regression is a regularisation technique that builds upon Ordinary Least Squares (OLS) to mitigate the problem of multicollinearity (high correlation between independent variables) and to prevent overfitting, particularly when dealing with a large number of predictors. Similar to OLS, Ridge Regression aims to estimate the coefficients of a linear model by minimising a cost or loss function. However, the key difference is that the Ridge Regression loss function adds a penalty term to the OLS loss function (the sum of squared residuals). This penalty term is proportional to the sum of the squared magnitudes (L2 norm) of the model coefficients. The inclusion of this penalty term, controlled by a regularisation parameter (lambda), forces the model to shrink the coefficients towards zero. Importantly, while Ridge Regression shrinks the coefficients, it typically does not force them to be exactly zero, meaning all the original predictors are usually retained in the model. By penalising large coefficients, Ridge Regression reduces the model's sensitivity to the training data, thereby decreasing the overall model variance and improving its generalisation performance on unseen data.
What are the key assumptions of linear regression, and what happens if they are violated?
Linear regression relies on several key assumptions to ensure that the estimated coefficients are unbiased, efficient, and reliable. These assumptions include:
- Linearity: The relationship between the independent and dependent variables is linear in parameters.
- Independence of Errors: The error terms (the differences between the observed and predicted values) are independent of each other.
- Homoscedasticity: The variance of the error terms is constant across all levels of the independent variables.
- Normality of Errors: The error terms are normally distributed.
- Exogeneity of Independent Variables: The independent variables are not correlated with the error terms.
Violation of these assumptions can lead to several problems. For instance, non-linearity might result in a model that poorly captures the true relationship between the variables. Correlated errors can affect the efficiency of the estimates. Heteroscedasticity (non-constant variance of errors) can lead to unreliable standard errors and thus incorrect inferences about the significance of the coefficients. Non-normal errors can affect the validity of hypothesis tests, especially with small sample sizes. If the exogeneity assumption is violated, the model estimates may be biased and misleading, as changes in the dependent variable might be incorrectly attributed to the independent variables. Addressing these violations often involves data transformations, using different modelling techniques, or employing more robust statistical methods.
How can a logistic regression model be used for binary classification, such as predicting whether Jenny will like a book based on its page count?
Logistic regression, despite its name, is a statistical model used for binary classification tasks, where the outcome variable has two possible categories (e.g., like/dislike, yes/no, 0/1). Unlike linear regression, which predicts a continuous outcome, logistic regression models the probability of the dependent variable belonging to a particular category. It achieves this by using a sigmoid function (or logistic function) to transform the linear combination of the input features into a probability value between 0 and 1. In the context of predicting whether Jenny will like a book based on its page count, the page count would be the independent variable. The logistic regression model would learn a non-linear relationship between the page count and the probability of Jenny liking the book. A threshold (typically 0.5) is then used to classify the book as either "liked" (probability ≥ 0.5) or "disliked" (probability < 0.5). The model can also reveal non-linear patterns in Jenny's preferences, identifying a "sweet spot" for page counts where the probability of liking increases significantly. By evaluating the model's accuracy against actual books Jenny has read (represented by green dots clustered around the predicted probability line), we can gain confidence in its ability to predict her preferences for new books. Adjusting the classification threshold (e.g., higher to avoid false positives, lower to avoid false negatives) can further customise the recommendations based on Jenny's preferences.
In the context of Linear Discriminant Analysis (LDA) for classification, how does it decide the boundary between different classes, such as Sarah's liked and disliked fruits based on size and sweetness?
Linear Discriminant Analysis (LDA) is a dimensionality reduction technique often used as a classifier. When used for classification, LDA aims to find a linear combination of features that best separates two or more classes. In the scenario of Sarah's fruit preferences, where size and sweetness are the features used to predict whether she likes or dislikes a fruit, LDA works by assuming that each class (liked and disliked) has a Gaussian distribution and that all classes share a common covariance matrix. LDA then tries to find a projection (a line or hyperplane in higher dimensions) that maximises the separation between the means of the classes while minimising the variance within each class. Imagine plotting each fruit on a graph where the x-axis is size and the y-axis is sweetness. LDA attempts to draw the "best possible line" to separate the liked fruits from the disliked fruits. While some overlap between the classes might occur, LDA strives to find the linear boundary that achieves the most effective overall separation based on the statistical properties of the data. This allows Sarah to combine information from multiple features (size and sweetness) to make potentially better predictions about whether she will like a new fruit.
What is the underlying principle of Naive Bayes classifiers, and in what scenarios might they be preferred over more complex models like logistic regression?
Naive Bayes classifiers are a family of probabilistic classifiers based on Bayes' theorem. The "naive" aspect of these classifiers comes from the strong assumption of independence between the features, meaning that the presence or absence of one feature does not affect the presence or absence of any other feature, given the class variable. Despite this simplifying assumption, Naive Bayes classifiers can perform surprisingly well in many real-world applications, especially when dealing with high-dimensional data. They work by calculating the probability of a data point belonging to each class based on the observed feature values and Bayes' theorem.
Naive Bayes classifiers might be preferred over more complex models like logistic regression in several scenarios:
- Small training data: Naive Bayes models often require less training data to achieve good performance compared to more complex models that have more parameters to learn.
- High dimensionality: They can handle a large number of features efficiently, as the feature independence assumption simplifies the parameter estimation process.
- Computational efficiency: Training and prediction with Naive Bayes classifiers are typically very fast, making them suitable for real-time applications or large datasets.
- Simplicity and interpretability: The underlying principles of Naive Bayes are relatively straightforward to understand, and the model can provide probabilities for class predictions.
However, the naive independence assumption can be a limitation when the features are indeed correlated. In such cases, more flexible models like logistic regression, which can learn complex, non-linear relationships between features and the outcome, might achieve higher accuracy. The choice between Naive Bayes and more complex models often involves a bias-variance trade-off. Naive Bayes typically exhibits higher bias due to its simplifying assumptions, leading to a less complex decision boundary. Logistic regression, on the other hand, has lower bias potential due to its flexibility but is more prone to overfitting the training data, especially with limited data. Therefore, the optimal model choice depends on the specific characteristics of the data and the problem at hand.
What is the purpose of the Pandas and NumPy libraries in the context of machine learning with Python?
Pandas is used for data manipulation and analysis, providing data structures like DataFrames that simplify working with structured data. NumPy supports numerical computations, offering efficient arrays and mathematical functions crucial for data preprocessing and the implementation of machine learning algorithms. Together, these libraries form the backbone of data preparation and initial analysis stages in machine learning projects.
Explain the difference between simple and multiple linear regression.
Simple linear regression models the relationship between a single independent variable and a dependent variable. In contrast, multiple linear regression models the relationship between two or more independent variables and a dependent variable, allowing for a more complex analysis of influencing factors. This complexity enables a more nuanced understanding of how multiple factors can impact the outcome.
Explain the role of a 'test set' in evaluating the performance of a machine learning model.
A test set is a portion of the data that the machine learning model has never seen during training. By evaluating the model's performance on this unseen data, we can get an unbiased estimate of how well the model generalises to new, real-world data, indicating its predictive capability. This step is crucial for assessing the model's robustness and reliability.
What is the significance of the 0.5 threshold in a logistic regression model used for binary classification?
In binary classification with logistic regression, the 0.5 threshold is a common decision boundary used to translate the continuous probability values (ranging from 0 to 1) into discrete class labels (e.g., like or dislike, spam or not spam). If the predicted probability is above 0.5, the instance is typically assigned to one class, and below 0.5, it's assigned to the other. Adjusting this threshold can fine-tune the sensitivity and specificity of the model.
How does Linear Discriminant Analysis (LDA) differ from using individual features for classification?
LDA is a dimensionality reduction and classification technique that aims to find the optimal linear combination of features that best separates different classes. Unlike considering each feature in isolation, LDA simultaneously takes into account multiple features to establish a more effective decision boundary for classification. This holistic approach often results in improved classification accuracy.
What is the purpose of ensemble methods like Bagging in machine learning?
Ensemble methods like Bagging aim to improve the stability and accuracy of machine learning models by training multiple base learners (often of the same type) on different subsets of the training data, and then aggregating their predictions. This helps to reduce variance and prevent overfitting, leading to more robust and reliable predictions. Bagging is particularly effective in scenarios where individual models are prone to high variance.
Explain the concept of ensemble learning and elaborate on the Bagging technique.
Ensemble learning is a machine learning technique that combines the predictions of multiple individual models to improve overall performance and robustness. The Bagging technique, short for bootstrap aggregating, involves training multiple instances of the same base learner on different random subsets of the training data (sampled with replacement) and then aggregating their predictions (e.g., by averaging or majority voting). This process helps to reduce variance and improve model generalisation. However, it requires careful consideration of computational resources and the choice of base learners to ensure optimal results.
Explain the core assumption of Naive Bayes classifiers regarding the relationship between features.
The core assumption of Naive Bayes classifiers is that all features are conditionally independent of each other given the class label. This "naive" assumption simplifies the calculations involved in the algorithm, even though it may not always hold true in real-world datasets. Despite this limitation, Naive Bayes often performs well in practice, particularly for text classification tasks.
What are some common challenges faced when implementing machine learning models in real-world applications?
Implementing machine learning models in real-world applications can present several challenges, including:
- Data Quality: Poor quality data can lead to inaccurate models. Ensuring data is clean, complete, and representative is crucial.
- Overfitting: Models may perform well on training data but poorly on unseen data. Techniques like regularisation and cross-validation can help mitigate this.
- Model Interpretability: Complex models can be difficult to interpret, making it challenging to explain decisions to stakeholders.
- Scalability: Models need to handle large volumes of data efficiently, requiring optimised algorithms and infrastructure.
- Ethical Considerations: Ensuring models are fair and unbiased, especially in sensitive applications like hiring or lending, is essential.
Addressing these challenges requires a combination of technical skills, domain knowledge, and a thoughtful approach to model development and deployment.
What are some practical applications of machine learning in business?
Machine learning has numerous practical applications in business, including:
- Customer Segmentation: Using clustering algorithms to group customers based on purchasing behavior, enabling targeted marketing strategies.
- Predictive Maintenance: Analyzing sensor data from equipment to predict failures before they occur, reducing downtime and maintenance costs.
- Fraud Detection: Implementing anomaly detection algorithms to identify fraudulent transactions in real-time.
- Recommendation Systems: Utilizing collaborative filtering to suggest products or content to users based on their preferences and behavior.
- Supply Chain Optimization: Forecasting demand and optimizing inventory levels using time series analysis and regression models.
These applications demonstrate how machine learning can drive efficiency, enhance customer experiences, and create competitive advantages for businesses.
Why is data preprocessing crucial in a machine learning project?
Data preprocessing is a critical step in a machine learning project because it directly impacts the model's performance. Raw data often contains noise, missing values, and inconsistencies that can lead to inaccurate models. Preprocessing involves cleaning the data, handling missing values, normalizing or scaling features, and encoding categorical variables. This process ensures that the data is in a suitable format for model training, leading to more reliable and accurate predictions. Skipping or inadequately performing data preprocessing can result in models that fail to generalize well to new data.
What are some challenges associated with deploying machine learning models?
Deploying machine learning models comes with several challenges, including:
- Integration: Ensuring the model integrates seamlessly with existing systems and workflows can be complex.
- Scalability: The model must handle increased loads and data volumes efficiently without compromising performance.
- Monitoring: Continuously monitoring the model's performance in production to detect drift or degradation is essential for maintaining accuracy.
- Security: Protecting the model and data from unauthorized access and ensuring compliance with data privacy regulations is crucial.
- Version Control: Managing different versions of the model and tracking changes to ensure reproducibility and consistency.
Addressing these challenges requires careful planning, robust infrastructure, and ongoing maintenance to ensure the model remains effective and reliable in a production environment.
How does deep learning differ from traditional machine learning?
Deep learning is a subset of machine learning that focuses on neural networks with many layers (deep neural networks). Unlike traditional machine learning, which often requires manual feature extraction, deep learning automatically learns features from raw data, making it well-suited for complex tasks like image and speech recognition. Deep learning models can capture intricate patterns and relationships in data, but they typically require large amounts of data and computational resources. Traditional machine learning algorithms, on the other hand, are often simpler and more interpretable, making them suitable for structured data and smaller datasets. The choice between deep learning and traditional machine learning depends on the problem complexity, data availability, and computational constraints.
Why is regularization important in machine learning models?
Regularization is a technique used to prevent overfitting in machine learning models by adding a penalty term to the loss function. This penalty discourages the model from fitting too closely to the training data, which can lead to poor generalization on unseen data. Regularization techniques like L1 (Lasso) and L2 (Ridge) regularization help to reduce model complexity by constraining the magnitude of the coefficients. This results in a model that is more robust and less sensitive to noise in the data. Regularization is particularly important when dealing with high-dimensional data or when the number of features exceeds the number of observations. It helps to improve the model's predictive performance and stability.
What is model interpretability, and why is it important?
Model interpretability refers to the ability to understand and explain how a machine learning model makes its predictions. Interpretability is crucial for several reasons: it builds trust with stakeholders, provides insights into the underlying data patterns, and helps identify biases or errors in the model. In regulated industries, interpretability is often a legal requirement to ensure transparency and accountability. While simple models like linear regression are inherently interpretable, complex models like deep neural networks require techniques such as SHAP values or LIME to make them more understandable. Ensuring interpretability is essential for deploying machine learning models in real-world applications where decisions have significant consequences.
How do you choose the right machine learning model for a given problem?
Choosing the right machine learning model involves considering several factors:
- Nature of the Problem: Determine whether the task is regression, classification, clustering, etc., and select models suited for that task.
- Data Characteristics: Consider the size, dimensionality, and quality of the data. Some models handle high-dimensional data better than others.
- Interpretability Requirements: Decide if model transparency is crucial for the application.
- Computational Resources: Evaluate the available resources and select models that can be trained and deployed efficiently.
- Performance Metrics: Identify the key metrics for evaluating model performance (e.g., accuracy, precision, recall) and choose models that optimize these metrics.
Experimenting with different models, using techniques like cross-validation, and leveraging domain knowledge can help identify the most suitable model for a given problem.
Certification
About the Certification
Show the world you have AI skills. Gain hands-on experience with Python, machine learning, and data science—essential tools that help you advance your expertise and stand out in an evolving tech landscape.
Official Certification
Upon successful completion of the "Certification: AI Foundations with Python, Machine Learning & Data Science", you will receive a verifiable digital certificate. This certificate demonstrates your expertise in the subject matter covered in this course.
Benefits of Certification
- Enhance your professional credibility and stand out in the job market.
- Validate your skills and knowledge in cutting-edge AI technologies.
- Unlock new career opportunities in the rapidly growing AI field.
- Share your achievement on your resume, LinkedIn, and other professional platforms.
How to complete your certification successfully?
To earn your certification, you’ll need to complete all video lessons, study the guide carefully, and review the FAQ. After that, you’ll be prepared to pass the certification requirements.
Other AI Video Courses
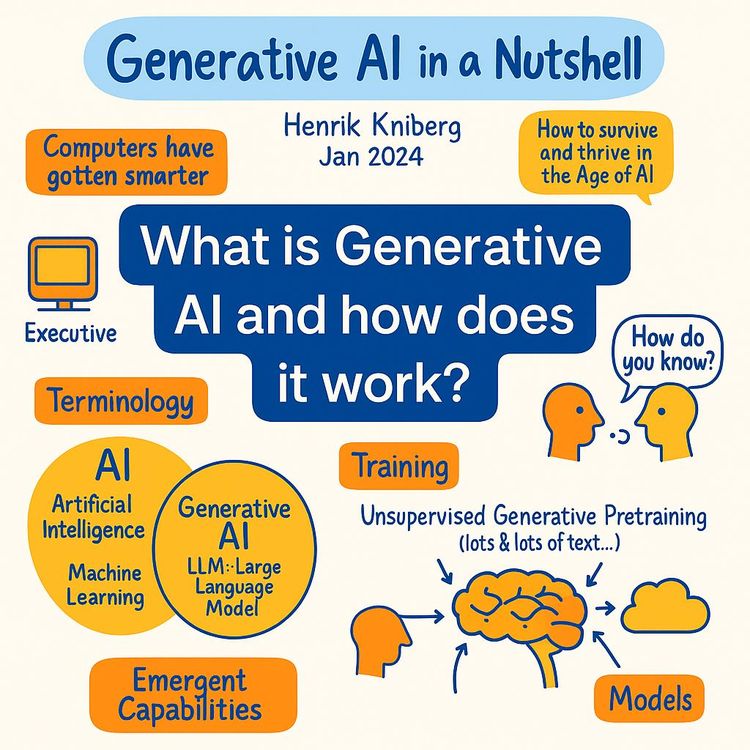
Video Course: What is Generative AI and how does it work?

Video Course: How to Use ChatGPT from Beginner to Professional

Video Course: How to Use Google Gemini for Google Workspace to Boost Productivity

Video Course: How to Use Claude 3.7 AI - Tips for Beginners!

Video Course: ChatGPT for Data Analytics: Full Course - from Beginners to Professional

Video Course: Generating Images and photos With ChatGPT?

Video Course: Generating Images & Photo's with MidJourney

Video Course: Generating Design's with Microsoft Designer and AI

Video Course: Generating Design's with Canva.com and AI
Join 20,000+ Professionals, Using AI to transform their Careers
Join professionals who didn’t just adapt, they thrived. You can too, with AI training designed for your job.