AI agent for public health officers
Community Health Assessment Data Agent
A set of comparable, stable health indicators with benchmarks for the assessment
What it does
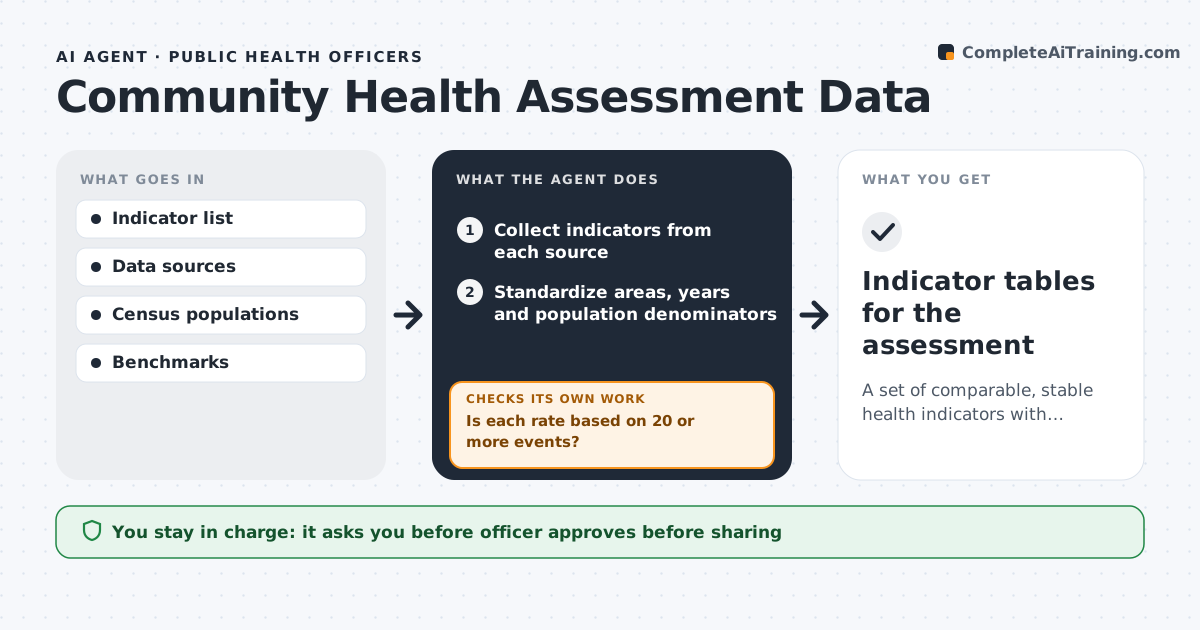
Every few years, health departments write a community health assessment covering disease rates, risk factors and social conditions. Pulling dozens of indicators into one fair comparison is slow. This agent collects indicators from vital statistics, surveys, hospital data and census sources, then standardizes areas, years and population denominators. It checks that each rate rests on 20 or more events. If not, it combines years or suppresses the indicator and notes why. It uses age-adjusted rates where available and compares each indicator with state and national benchmarks from the same year where possible. It highlights the largest gaps by area and group. The officer reviews the tables before they go to community partners, who help set priorities. Edge case: rates based on fewer than 20 events are marked unstable and never ranked.
How it works
Follow the arrows from top to bottom. The orange dashed arrow is the loop: when a check fails, the agent goes back and tries again.
Read the steps as a list
- Assessment cycle begins
- Collect indicators from each source
- Standardize areas, years and population denominators
- Is each rate based on 20 or more events?If not: combine years or suppress the indicator and note why. Back to step 3.
- Compare with state and national benchmarks
- Highlight the largest gaps by area and group
- Officer reviews tables before sharing with partnersThe agent waits here for your OK.
- Indicator tables for the assessment
How it decides
Indicators are compared only when areas and years match. Small counts are combined across years or suppressed.
- Fewer than 20 events means unstable
- Age-adjusted rates where available
- Benchmarks from the same year where possible
Make it yours
Every agent is a starting point. You choose these settings for your own situation.
- Indicator list
- Stability threshold (default 20 events)
- Geographic units
- Benchmarks to use
What keeps you in control
It always asks you first
- Officer approves before sharing
- Priorities are set by people, not the agent
Hard limits
- Suppresses small numbers to protect privacy
- Never publishes data
It stops when
- Done: all indicators processed
- Stop: key source unavailable
Set it up
We guide you through the set-up, step by step
Members get the full set-up guide for this agent. No technical skills needed: you copy, paste and upload.
- One set of instructions to paste into your AI, with the clicks for ChatGPT, Claude, Microsoft 365 Copilot, Gemini and Grok
- The agent then walks you through connecting your own data, one source at a time
- A downloadable copy with the flow chart, the rules and the full guide