AI agent for business intelligence analysts
Dashboard Data Trust Agent
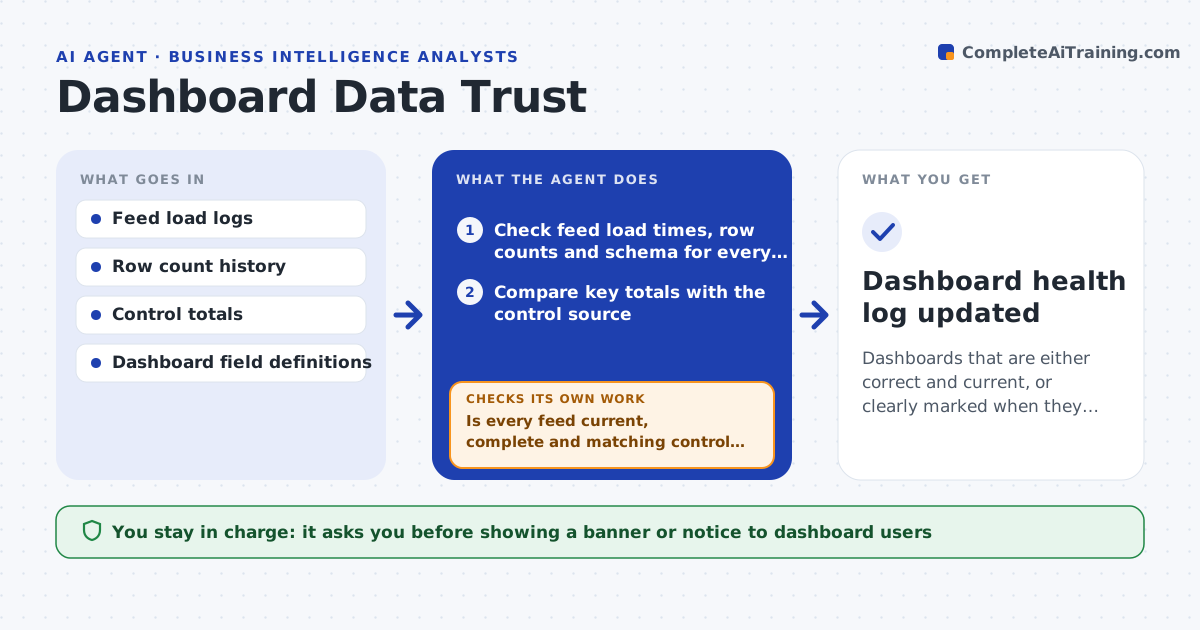
Dashboards that are either correct and current, or clearly marked when they are not
What it does
Dashboards depend on data feeds that can break, lag or change shape without warning, and users lose trust when numbers are quietly wrong. Each morning and after each refresh this agent checks that every feed loaded on time, row counts sit in the normal range, and key totals match a control source. It also checks for schema changes, like a renamed column, that would break a chart. When something is wrong, it works out whether it is a late feed, a data issue or a broken field, and reruns the refresh when that is safe. If the rerun does not fix it, it marks the affected tiles as not current and alerts the owner. You approve any banner shown to users. Edge case: a real drop, like a slow holiday sales day, is not flagged after checking against last year.
How it works
Follow the arrows from top to bottom. The orange dashed arrow is the loop: when a check fails, the agent goes back and tries again.
Read the steps as a list
- Scheduled refresh finishes
- Check feed load times, row counts and schema for every source
- Compare key totals with the control source
- Compare any unusual drop with the same period last year
- Is every feed current, complete and matching control totals?If not: identify the late, broken or wrong feed and rerun its refresh. Back to step 2.
- Did the rerun fix the feed?If not: mark the affected tiles as not current and alert the dashboard owner. Back to step 3.
- Draft a short health note and a user banner if needed
- Owner approves any user-facing bannerThe agent waits here for your OK.
- Dashboard health log updated
How it decides
It compares loads and totals with normal ranges and control sources, and marks tiles stale when it cannot confirm they are current.
- Mark tiles stale when data cannot be confirmed
- Separate a real low day from a broken feed
- Rerun a refresh at most twice before escalating
Make it yours
Every agent is a starting point. You choose these settings for your own situation.
- Control totals and tolerance
- Normal row count ranges
- Dashboards in scope
- Who is alerted
What keeps you in control
It always asks you first
- Showing a banner or notice to dashboard users
Hard limits
- Never changes dashboard numbers manually
- No user banner without approval
It stops when
- Done: dashboards verified or marked stale
- Stop: pipeline logs unavailable
Set it up
We guide you through the set-up, step by step
Members get the full set-up guide for this agent. No technical skills needed: you copy, paste and upload.
- One set of instructions to paste into your AI, with the clicks for ChatGPT, Claude, Microsoft 365 Copilot, Gemini and Grok
- The agent then walks you through connecting your own data, one source at a time
- A downloadable copy with the flow chart, the rules and the full guide