
AI agent for supply chain analysts
New Product Demand Ramp Agent
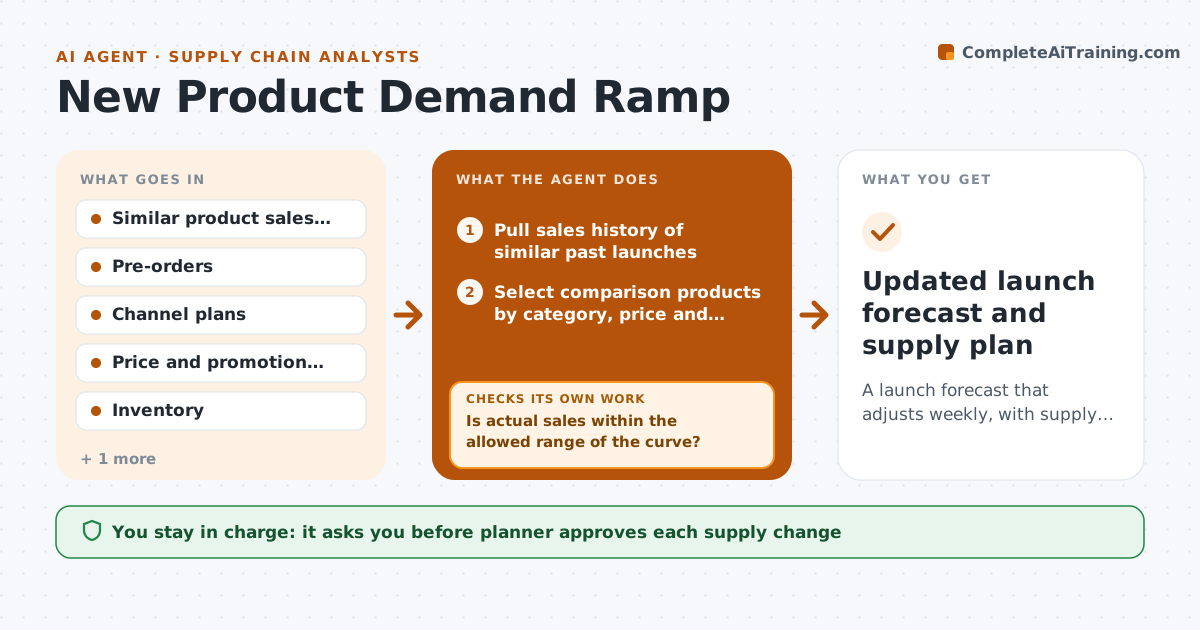
A launch forecast that adjusts weekly, with supply changes proposed when actuals depart from the curve.
What it does
A new product launches with no history, so you guess, and weeks later you are either out of stock or buried in it. This agent builds the first forecast from similar past launches, pre-orders and channel plans. It picks comparison products by category, price and channel, scales their sales curves, and blends them with pre-order data. Every week after launch, it compares actual sales with the curve. If actuals miss by more than your range, it re-picks the comparison products and reruns the forecast. Then it drafts supply changes, like new order quantities. The planner approves any supply change. Edge case: a sell-through limited by stockouts is adjusted before comparison, since those sales were lost.
How it works
Follow the arrows from top to bottom. The orange dashed arrow is the loop: when a check fails, the agent goes back and tries again.
Read the steps as a list
- Launch planning or weekly review
- Pull sales history of similar past launches
- Select comparison products by category, price and channel
- Build the demand curve with pre-orders and channel plans
- Compare weekly actual sales with the curve
- Is actual sales within the allowed range of the curve?If not: Re-pick comparison products, adjust for stockouts and rerun the curve. Back to step 3.
- Compute stock cover and supply gaps
- Draft supply change proposals
- Do proposals fit supplier lead times and minimum order sizes?If not: Revise quantities or timing and redraft. Back to step 8.
- Planner approves supply changesThe agent waits here for your OK.
- Updated launch forecast and supply plan
How it decides
It picks 3 to 5 comparison launches with the closest match and weights them by similarity, then adjusts the curve by actual sell-through.
- Use 3 to 5 comparison launches
- Treat actuals as off-curve when more than 25% away for 2 weeks
- Remove stockout weeks from actuals
- Propose supply changes only if cover drops under 3 weeks
Make it yours
Every agent is a starting point. You choose these settings for your own situation.
- Range allowed around the curve (default 25%)
- Number of comparisons
- Review day
- Cover threshold in weeks
What keeps you in control
It always asks you first
- Planner approves each supply change
Hard limits
- Never place purchase orders
- Never present a forecast as certain
It stops when
- Done: stable forecast and approved supply plan
- Stop: no comparable launches exist
Set it up
We guide you through the set-up, step by step
Members get the full set-up guide for this agent. No technical skills needed: you copy, paste and upload.
- One set of instructions to paste into your AI, with the clicks for ChatGPT, Claude, Microsoft 365 Copilot, Gemini and Grok
- The agent then walks you through connecting your own data, one source at a time
- A downloadable copy with the flow chart, the rules and the full guide
An example run
More agents for supply chain analysts
 Quality control · Analysis
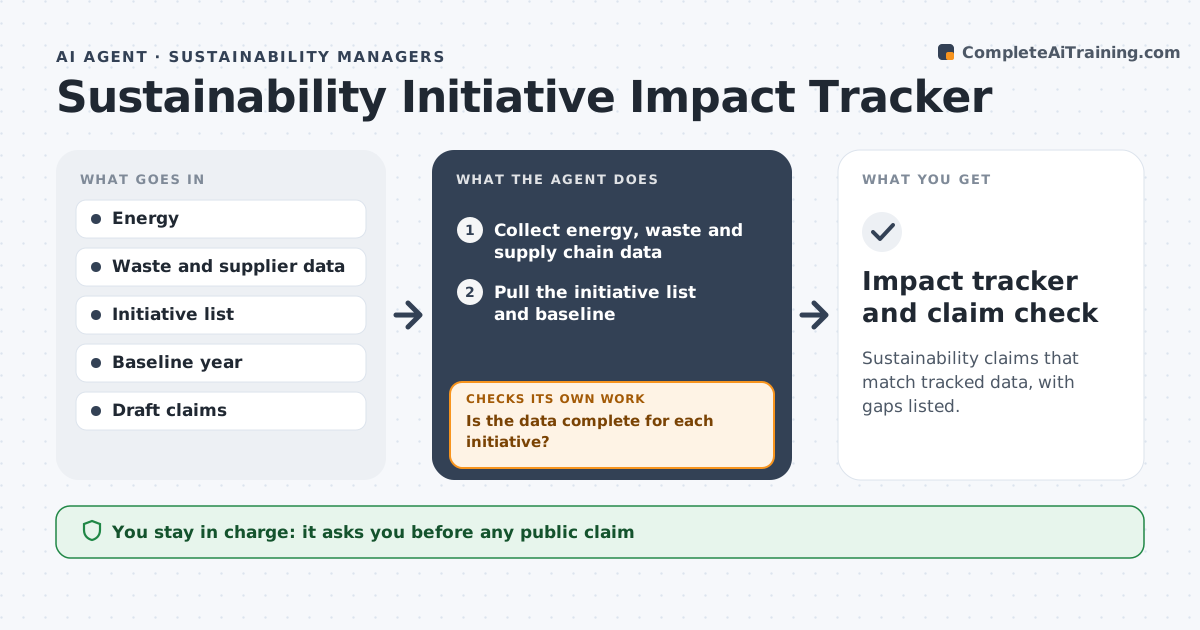
Sustainability Initiative Impact Tracker Agent
Sustainability claims that match tracked data, with gaps listed.
 Quality control · Management
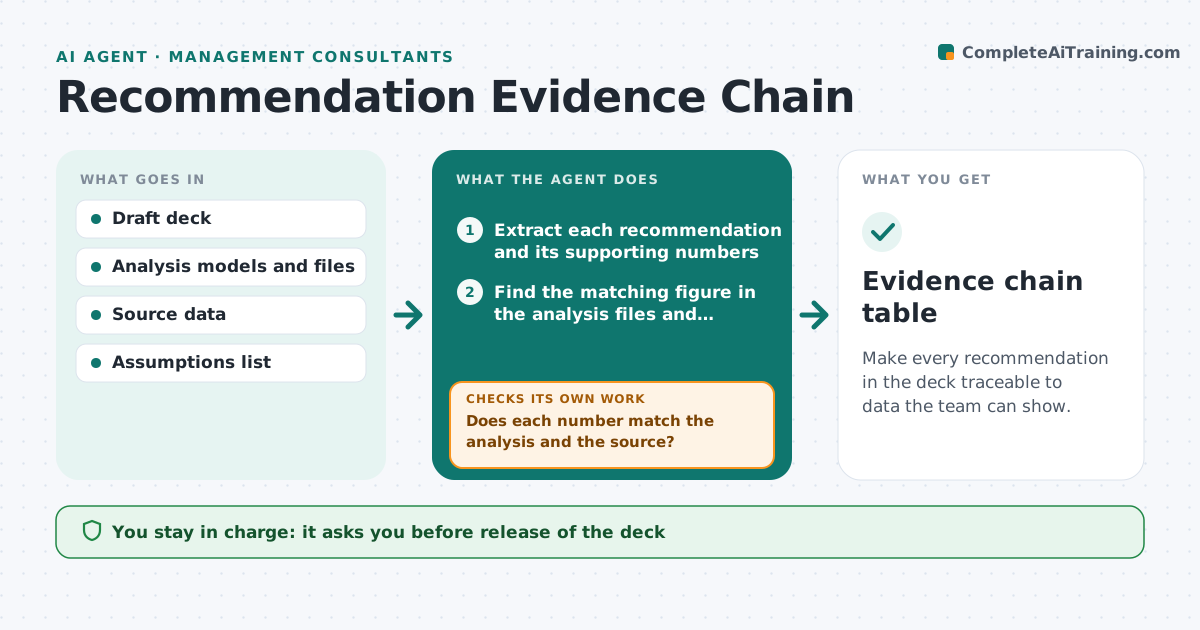
Recommendation Evidence Chain Agent
Make every recommendation in the deck traceable to data the team can show.
 Forecasting · Operations
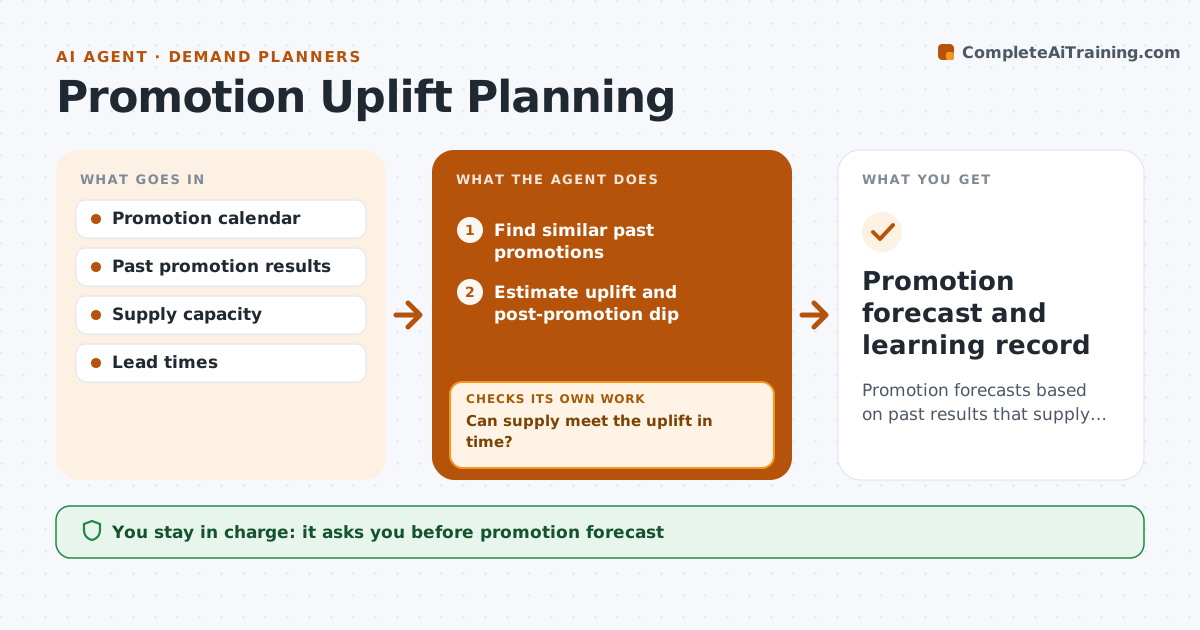
Promotion Uplift Planning Agent
Promotion forecasts based on past results that supply can meet
 Analysis · Automation
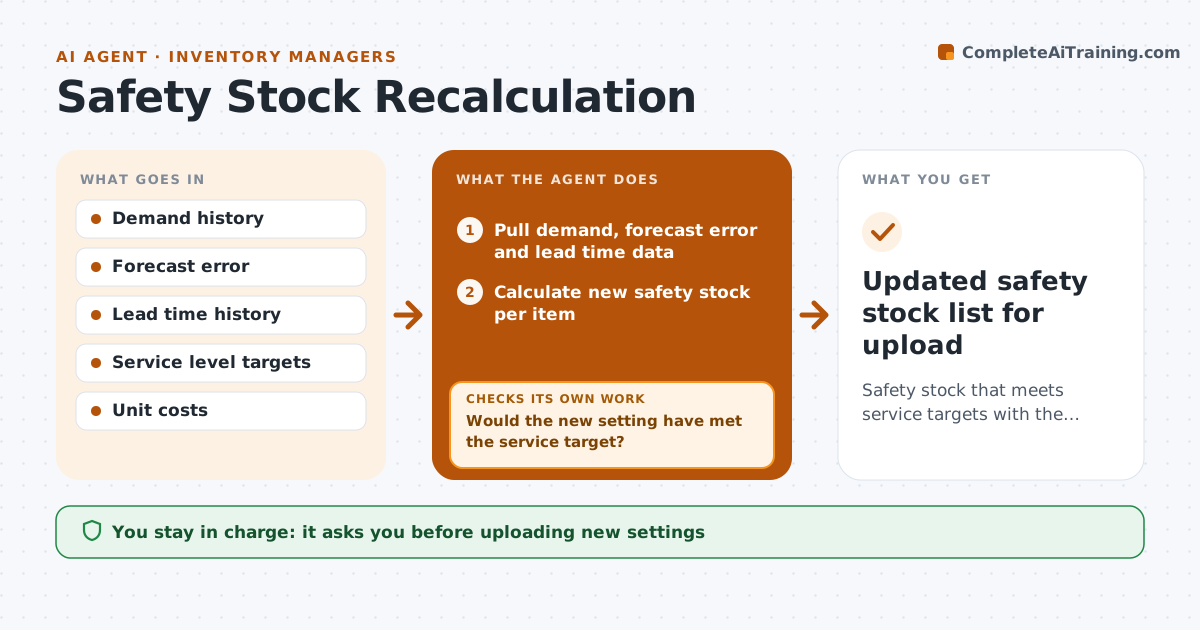
Safety Stock Recalculation Agent
Safety stock that meets service targets with the least inventory