Data Science & AI Beginner Course: ML, Deep Learning, TensorFlow (Video Course)
Turn messy data into decisions. In 12 hours, learn the math that matters, SQL, web scraping, ML, deep learning, NLP, time series, and MLOps. Build models, deploy them, monitor results, and apply skills across finance, healthcare, retail, and tech.
Related Certification: Certification in Building and Evaluating TensorFlow ML & Deep Learning Models
Also includes Access to All:
What You Will Learn
- Define AI, ML, and DL and apply essential math (linear algebra, calculus, probability, statistics)
- Build end-to-end data pipelines: acquisition (SQL, web scraping), cleaning, and EDA
- Engineer features and train core ML models (regression, trees, ensembles, SVM, k-means)
- Develop deep learning and NLP models with TensorFlow/Keras and embeddings
- Deploy and operate models with MLOps: versioning, CI/CD, monitoring, and retraining
Study Guide
Data Science & AI Full Course , A Complete Guide You Can Use Right Away
Data drives the decisions that move industries. This course will teach you how to turn raw, messy datasets into insights, predictions, and automated systems that scale. You'll start with the basics,definitions, math you actually need, and the end-to-end workflow. You'll then move into machine learning paradigms, core algorithms, deep learning, NLP, time series, and practical MLOps so your work survives beyond a notebook. Along the way, you'll see how these concepts apply in finance, healthcare, retail, and tech, and you'll learn how to move from theory to production. If you're a beginner, this is your on-ramp. If you're already in motion, this will deepen and operationalize your skills so you create measurable value.
What You'll Learn and Why It Matters
You will learn to define AI, ML, and DL clearly, set up data pipelines, build predictive models, choose the right algorithms, and deploy models with confidence. You'll master the foundations,linear algebra, calculus, probability, and statistics,at the level that lets you build and debug real systems. You'll also learn SQL for data access, web scraping for acquisition, and visualization for exploration. Finally, you'll learn how organizations move models to production using MLOps,automation, versioning, monitoring, and retraining. The payoff: reliable projects, faster iteration, and business outcomes you can point to.
Foundations: What Data Science, AI, ML, and DL Actually Mean
Data Science
Data Science is the interdisciplinary process of extracting knowledge from data. It blends statistics, programming, and domain insight to surface patterns, answer questions, and predict outcomes. It covers the lifecycle from data collection and cleaning through modeling and deployment.
Artificial Intelligence (AI)
AI is the umbrella term for techniques that enable computers to perform tasks we associate with human intelligence,reasoning, pattern recognition, decision-making, and language understanding. It includes everything from rule-based systems to neural networks.
Machine Learning (ML)
ML is a subset of AI where systems learn patterns from data instead of following hard-coded rules. An ML system improves its performance on a task as it is exposed to more data and feedback.
Deep Learning (DL)
DL is a subset of ML using multilayer neural networks that learn hierarchical representations of data. Early layers learn simple features, deeper layers learn abstract concepts. DL excels when you have large volumes of high-dimensional data like images, audio, and natural language.
Examples:
- AI: A rule-based expert system for loan eligibility; a search algorithm playing a board game with handcrafted heuristics.
- ML: A gradient boosted model predicting churn from customer attributes; a k-nearest neighbors model recommending items based on similarity.
- DL: A convolutional network identifying defects in manufacturing images; a recurrent or transformer-based model summarizing text.
Why Data Science Is a High-Leverage Career
- Demand is growing faster than the supply of skilled practitioners. Compensation reflects that scarcity and the value these systems create.
- Cross-industry relevance: finance, healthcare, retail, logistics, media, and the public sector all rely on data-driven decision making.
- Central to strategy: models influence pricing, product design, resource allocation, and risk management.
Examples:
- A logistics company reduces delivery times by optimizing routes with ML predictions of traffic and loading delays.
- A subscription business boosts retention by predicting which customers will cancel and triggering targeted save offers.
Team Roles: Analyst, Engineer, Scientist
Data Analyst
Collects, cleans, and visualizes data to answer "what happened" and "why" using SQL, spreadsheets, Python, and BI tools. Builds dashboards and reports. Supports hypothesis testing and business decisions.
Data Engineer
Builds data pipelines, manages storage, designs schemas, and ensures reliable, timely, quality data flows for downstream analysis and ML. Uses ETL/ELT frameworks, cloud services, and orchestration tools.
Data Scientist
Frames problems, explores data, engineers features, trains and evaluates models, and collaborates on deployment. Moves from experimentation to scalable inference, often working closely with ML engineers.
Examples:
- Analyst: Creates a cohort retention dashboard to explain user drop-offs by channel and geography.
- Engineer: Implements a streaming pipeline that ingests clickstream events into a warehouse for near-real-time analytics.
- Scientist: Develops a fraud detection model and partners with engineering to run it on live transactions.
The Essential Math: Only What Moves the Needle
Linear Algebra
Vectors, matrices, eigenvalues/eigenvectors. You need it for data representation, transformations, and algorithms like PCA. Matrix multiplication underpins neural networks and gradient computations.
Calculus (Multivariate)
Partial derivatives and gradients drive optimization. Gradient Descent adjusts model parameters to minimize loss. Understanding slopes and curvature helps diagnose training problems.
Probability & Bayes' Theorem
Probabilities quantify uncertainty. Bayes' theorem updates beliefs with evidence. Used in Naive Bayes, Bayesian inference, and uncertainty estimation. Knowing distributions (Normal, Bernoulli, Poisson) helps model assumptions and simulation.
Statistics
Descriptive stats summarize data (mean, median, variance). Inferential stats generalize from samples (confidence intervals, hypothesis tests, p-values). A/B testing and power analysis fit here.
Examples:
- Linear Algebra: PCA reduces dimensionality in a 500-feature dataset while preserving most variance; matrix factorization in recommendation systems decomposes user-item interactions.
- Calculus: Tuning learning rates and understanding why a model overshoots minima; Lagrange multipliers in SVM optimization (conceptually).
- Probability: Naive Bayes classifies emails with word likelihoods; Bayes updates disease probability after a positive test considering base rates.
- Statistics: A/B test evaluates a new checkout flow; control charts monitor process variation in manufacturing.
Best practices:
- Learn by coding: implement mean, variance, and gradient descent from scratch to internalize mechanics.
- Visualize: plot loss surfaces, distributions, and residuals to develop intuition.
SQL for Data Management
SQL is a core skill for extracting, joining, and aggregating data from relational databases. You'll use it to assemble datasets before modeling.
- Filtering and selection: WHERE, ORDER BY, LIMIT.
- Joins: INNER, LEFT, RIGHT, FULL to combine tables (customers and orders, users and events).
- Aggregations: GROUP BY with SUM, COUNT, AVG, MIN, MAX.
- Window functions: ranking, moving averages, running totals.
- Subqueries and CTEs for readable complex logic.
Examples:
- Join customer demographic data with transaction history to engineer features like spend per visit and time since last purchase.
- Create a rolling 7-day average of daily active users to smooth seasonality before forecasting.
Best practices:
- Push heavy aggregations into SQL to reduce data transferred to Python.
- Validate joins by checking row counts and duplicates before and after.
Data Acquisition and Preparation
Web Scraping
Use code to extract HTML content, parse it, and store structured data. Selenium handles dynamic pages that load content with JavaScript. Beautiful Soup parses static pages. Pandas organizes results into DataFrames.
Legal and Ethical Considerations
Check robots.txt, rate limits, and terms of service. Avoid scraping personal data without consent. Cache requests and be a good citizen.
Data Cleaning
- Handle missing values: drop, mean/median imputation, model-based imputation.
- Treat outliers: winsorization, transformation, or domain-driven caps.
- Standardize formats: consistent units, categories, timestamps.
- Remove duplicates and fix inconsistent keys.
Exploratory Data Analysis (EDA)
Use visualization (Matplotlib, Seaborn) and summaries to understand distributions, relationships, and potential data leakage.
Examples:
- Scrape product listings (title, price, rating) to compare competitor pricing; store into CSV for analysis.
- Clean a customer dataset by imputing missing ages, harmonizing country names, and removing duplicate accounts before churn modeling.
Best practices:
- Document every cleaning step to ensure reproducibility and trust.
- EDA before modeling: it prevents wrong assumptions and highlights leakage or bias early.
The Data Science Lifecycle
Most of your wins come from following a disciplined process. Skip steps and you pay for it later.
1) Problem framing: articulate the question, success metric, constraints, and decision that will use the model.
2) Data acquisition: identify sources, access patterns, and frequency; consider scraping, APIs, databases.
3) Data preparation: clean, join, transform, and document.
4) EDA: detect patterns, anomalies, relationships, and leakage.
5) Feature engineering: encode categories, scale numerical features, create domain features, select variables.
6) Modeling: choose baselines, iterate on algorithms, tune hyperparameters.
7) Evaluation: proper train/validation/test splits, cross-validation, robust metrics.
8) Deployment: package the model, set up inference, integrate with systems.
9) Monitoring: track drift, latency, errors, and business KPIs; close the feedback loop with retraining.
Examples:
- A bank frames "reduce false positives in fraud flags by 20% while maintaining recall"; evaluation uses precision, recall, and AUC.
- A retailer collects point-of-sale, web visits, and promotions data to forecast weekly demand by store and product.
Core Machine Learning Paradigms
Supervised Learning
Trains on labeled data: inputs X with known outputs Y. Goal: learn Y = f(X) for new data. Includes classification and regression.
Examples:
- Classification: Predict "spam vs. not spam" from email content; detect whether a transaction is fraud.
- Regression: Predict house prices from size, neighborhood, and condition; estimate time-to-failure for industrial equipment.
Unsupervised Learning
Finds structure in unlabeled data. Clustering, association rules, dimensionality reduction.
Examples:
- Clustering: Segment customers by behavior to drive targeted campaigns.
- Association: Market basket analysis reveals items frequently bought together for cross-sell placement.
Reinforcement Learning
An agent interacts with an environment, takes actions, and receives rewards or penalties. It balances exploration and exploitation to maximize cumulative reward.
Key concepts:
Agent, environment, action, reward, state, policy, value function, exploration vs. exploitation.
Examples:
- Robotics: A robot learns to grasp objects with minimal drops via trial and error.
- Dynamic pricing: An agent adjusts prices in response to demand signals to maximize revenue over time.
Semi-Supervised Learning
Leverages a small labeled set plus a large unlabeled set to learn effectively when labeling is expensive.
Examples:
- Medical imaging: Limited labeled scans augmented with many unlabeled images improves tumor detection.
- Document classification: A few labeled legal documents plus a large unlabeled archive enable accurate topic tagging.
From Data to Prediction: A Practical Predictive Analytics Workflow
1) Explore the dataset: load with Pandas, inspect dtypes, describe(), head(), and visualize distributions.
2) Clean the data: handle missing values, outliers, duplicates, inconsistent categories.
3) Model: choose features, split into train/test, select algorithms, and train.
4) Evaluate: use appropriate metrics, cross-validate, and stress-test generalization.
Examples:
- House price prediction: Linear Regression on features like sqft_living, bedrooms, and condition. Evaluate with R-squared and RMSE.
- Customer churn: Logistic Regression with features like tenure, support tickets, engagement frequency. Evaluate with precision/recall and ROC-AUC.
Best practices:
- Always create a simple baseline (mean predictor for regression, majority class for classification) to measure improvement.
- Use a validation set or cross-validation for hyperparameter tuning; keep a hold-out test set untouched until final evaluation.
Deep Dive: Core Algorithms You'll Use Often
Linear Regression
Predicts a continuous value. Fits a line (or hyperplane) minimizing squared error. Interpret coefficients to understand feature influence.
Examples:
- Predict energy consumption from weather, occupancy, and time-of-day features.
- Forecast ad spend ROI from channel, creative type, audience, and season.
Tips:
- Check residual plots for non-linearity and heteroscedasticity.
- Use regularization (L1/Lasso, L2/Ridge) to handle multicollinearity and avoid overfitting.
Logistic Regression
Classification algorithm modeling log-odds via a sigmoid function. Outputs probabilities for a binary outcome.
Examples:
- Predict loan default probability from income, debt-to-income, and credit history.
- Predict whether a user will click an ad based on context and user features.
Tips:
- Calibrate decision thresholds to match business costs (e.g., false positives vs. false negatives).
- Use regularization to prevent overfitting; check for class imbalance.
Decision Trees
Tree-structured decisions that split data by feature questions. They use impurity measures like entropy or Gini.
Key concepts:
Entropy quantifies uncertainty. Information Gain measures the reduction in entropy after a split. Choose splits that maximize gain.
Examples:
- Titanic survival prediction splits first on sex, then age, then class to reach pure leaves.
- Credit approval where initial splits are on existing debt level and recent delinquencies.
Random Forest
Ensemble of decision trees trained on bootstrapped samples with feature randomness at each split. Aggregates predictions (majority vote for classification, average for regression).
Examples:
- Fraud detection where diverse trees capture different signal pockets, reducing variance.
- Price estimation across neighborhoods where non-linear interactions are captured robustly.
Tips:
- Tune number of trees and max depth; too deep can memorize, too shallow can miss nuance.
- Use feature importance to guide feature engineering, but be wary of bias toward high-cardinality features.
Support Vector Machines (SVM)
Finds a maximum-margin hyperplane separating classes; kernel trick enables non-linear boundaries.
Examples:
- Classify sentiment in short product reviews where boundaries are crisp in a transformed space.
- Identify defective components from sensor vectors with tight margins between normal and faulty.
Naive Bayes
Probabilistic classifier using Bayes' theorem with a conditional independence assumption. Works well with text features (word counts or TF-IDF).
Examples:
- Spam filtering using word likelihoods and prior probabilities.
- Topic classification of support tickets into categories for routing.
k-Means Clustering
Partitions data into k clusters by minimizing within-cluster variance.
Examples:
- Customer segmentation by purchase behavior and recency/frequency/monetary metrics.
- Image color quantization to reduce colors for compression while preserving appearance.
Evaluation and Validation
- Regression: RMSE, MAE, R-squared.
- Classification: Accuracy, precision, recall, F1, ROC-AUC, PR-AUC.
- Confusion matrix to diagnose error types.
Examples:
- For churn models, track precision/recall to avoid wasting retention budgets on loyal users.
- For medical screening, optimize recall to catch as many positive cases as possible while monitoring precision.
Feature Engineering and Data Preparation in Detail
- Encoding: One-hot for nominal categories; ordinal encoding where order matters.
- Scaling: Standardization (z-score) or MinMax scaling for distance-based models and gradient descent stability.
- Text: Tokenization, stopword removal, stemming/lemmatization; representations like Bag-of-Words, TF-IDF, and embeddings.
- Missing data: Simple imputation (mean/median/mode) or model-based imputation; flag imputed values with indicator features.
- Outliers: Log transforms, robust scalers, or domain-informed caps.
- Leakage: Prevent target information from sneaking into features (e.g., post-outcome fields).
Examples:
- One-hot encode "payment_method" to capture behavioral differences in churn models.
- Scale numeric features for k-nearest neighbors on customer similarity to avoid dominance by large-scale variables.
Best practices:
- Fit preprocessing only on training data and apply the same transforms to validation/test to avoid leakage.
- Bundle preprocessing and model into a single pipeline for reproducibility.
Natural Language Processing (NLP)
NLP teaches machines to understand and generate human language.
Core tasks
- Tokenization: split text into words or subwords.
- Stemming and Lemmatization: reduce words to base form for normalization.
- POS Tagging: identify grammatical roles.
- Named Entity Recognition: locate names of people, organizations, places.
- Sentiment Analysis: classify polarity or emotion in text.
Tools and Algorithms
- NLTK for foundational processing; scikit-learn for classical models; TensorFlow/Keras for deep models.
- Naive Bayes and Logistic Regression with TF-IDF for baseline text classification.
- Embeddings and deep models for higher accuracy when data and compute allow.
Examples:
- Classify customer feedback into positive, neutral, negative with Logistic Regression on TF-IDF features.
- Extract entities (company names, product SKUs) from support emails to automate routing.
Best practices:
- Start with simple, interpretable models; upgrade to deep architectures only if metrics and ROI justify the complexity.
- Clean text consistently: handle casing, punctuation, and special tokens in a deterministic way.
Time Series Analysis
Time-ordered data requires specialized methods. Components include trend (long-term movement), seasonality (repeating patterns), and irregularity (noise). Many models assume stationarity,constant mean and variance over time,so transformations or differencing may be needed.
ARIMA
Combines autoregression (AR), differencing (I), and moving average (MA) components. Parameter selection often guided by autocorrelation plots. Extensions like SARIMA handle seasonality.
Examples:
- Forecast weekly sales per product-store using SARIMA with seasonal terms matching the weekly cycle.
- Predict server load to provision compute capacity proactively, avoiding outages.
Best practices:
- Use walk-forward validation to mimic real forecasting conditions.
- Capture holidays, promotions, and events with external regressors; they are often the real drivers.
Deep Learning and Neural Networks
How Neural Nets Learn
Inputs propagate through layers; each neuron applies a weighted sum plus activation (ReLU, sigmoid). Predictions are compared to targets with a loss function. Backpropagation and gradient descent update weights to reduce loss.
Architectures
- CNNs: use convolutional filters; ideal for images and spatial data.
- RNNs (and variants): handle sequences; good for text, time series.
- Transformers: attention mechanisms capture long-range dependencies in sequences; strong performance in language tasks.
Frameworks
TensorFlow (with Keras) and PyTorch. Keras provides a clean API for defining, training, and evaluating models; TensorFlow scales easily and supports production-grade serving.
Examples:
- Image classification: A CNN trained on labeled product images to detect defects.
- Speech intent detection: A recurrent or transformer-based model classifies spoken commands for virtual assistants.
Best practices:
- Start with pre-trained models and fine-tune when data is limited.
- Monitor training/validation curves to prevent overfitting; use dropout, early stopping, and data augmentation as needed.
Building a Neural Network with TensorFlow (Practical Overview)
1) Import libraries (TensorFlow, Keras, NumPy, Matplotlib).
2) Load and preprocess data (normalize inputs, train/test split).
3) Define a Sequential model: Flatten input, add Dense layers with ReLU activations, and a final Dense layer with Softmax for multiclass outputs.
4) Compile with optimizer (Adam), loss (sparse_categorical_crossentropy), and metrics (accuracy).
5) Fit on training data for several epochs; validate each epoch.
6) Evaluate on test data; analyze misclassifications to guide iteration.
Examples:
- Digit recognition on handwritten images; extend to multi-class document classifier for routing invoices, receipts, and contracts.
- Tabular churn classification with a small dense network when feature interactions are non-linear and complex.
MLOps: Operationalizing Machine Learning
MLOps applies DevOps principles to ML systems,automation, continuous delivery, and collaboration,to reduce friction from notebook to production. It covers data, code, and model versioning, pipeline automation, reproducibility, deployment, and monitoring.
Key Principles
- Automation: data preprocessing, model training, testing, and deployment pipelines.
- Collaboration: shared experiment tracking, code reviews, and model registries.
- Continuous processes: integration (CI), delivery (CD), training (CT), and monitoring (CM).
Lifecycle
1) Data preparation and versioning.
2) Model development and experiment tracking.
3) Packaging and deployment (cloud, edge, batch, streaming).
4) Monitoring for performance, drift, and latency.
5) Feedback loop to trigger retraining and re-deployment.
Tools
- Orchestration: Kubeflow, Airflow.
- CI/CD: Jenkins, GitHub Actions.
- Serving: TensorFlow Serving, Docker, Kubernetes.
- Monitoring: Prometheus, Grafana.
- Experiment tracking: MLflow, Weights & Biases.
Examples:
- E-commerce recommendation model retrains weekly with a scheduled pipeline; monitoring alerts trigger retraining when click-through drops below a threshold.
- A credit risk model is containerized with Docker, deployed on Kubernetes with canary releases, and rollbacks on performance degradation.
Best practices:
- Version everything: data snapshots, code, models, configs.
- Instrument your model: log features, predictions, and outcomes; monitor drift and business KPIs, not just accuracy.
Applications Across Sectors
Finance & Banking
- Fraud detection with anomaly detection and supervised classification on transaction streams.
- Credit scoring using Logistic Regression and gradient boosted trees; explainability is crucial for compliance.
Healthcare
- Medical imaging with CNNs to detect anomalies on X-rays and MRIs.
- NLP on clinical notes to extract diagnoses, medications, and social determinants of health.
Retail & E-commerce
- Recommendations via collaborative filtering and deep retrieval models.
- Dynamic pricing and promotion optimization using reinforcement learning and demand forecasting.
Technology & Automotive
- Computer vision for lane detection and object tracking in autonomous systems.
- Voice interaction using ASR and intent classification.
Public Sector
- Resource allocation with predictive models for emergency services placement.
- Traffic forecasting and route optimization with geospatial time series.
Examples:
- A bank reduces fraud loss by scoring each transaction in real time and stepping up authentication when risk is high.
- A retailer lifts revenue by recommending bundles discovered through association rules and validated with A/B tests.
A Closer Look at Google Maps as a Data Science System
Maps consolidates data from millions of devices and sensors to estimate traffic, suggest optimal routes, and detect incidents. It's a full-stack system: data ingestion, cleaning, time series modeling, graph algorithms for routing, and reinforcement signals from user behavior.
Examples:
- Predicting arrival times with time-of-day and day-of-week patterns learned from historical flows.
- Rerouting based on anomaly detection indicating an accident or road closure.
Model Evaluation, Bias-Variance, and Regularization
Bias-Variance Tradeoff
High bias underfits (too simple); high variance overfits (too complex). Goal: balance for best generalization.
Regularization
L1 (Lasso) encourages sparsity, L2 (Ridge) penalizes large coefficients. Early stopping and dropout regularize neural networks.
Examples:
- A decision tree with unlimited depth memorizes training data but fails on new samples; pruning or limiting depth reduces variance.
- A linear model with L1 selects a compact set of features, improving interpretability and robustness.
Practical Predictive Analytics Example: House Price Prediction
1) Load data: drop non-informative fields like id; parse date if needed.
2) EDA: scatter plots of sqft vs. price; boxplots by neighborhood; correlation heatmap.
3) Cleaning: impute missing values; treat extreme outliers; standardize numeric features.
4) Modeling: split into train/test; baseline with mean predictor; Linear Regression; then Random Forest if non-linearities appear.
5) Evaluation: R-squared for fit; RMSE for error magnitude; residual analysis for homoscedasticity.
6) Iterate: feature crosses (e.g., sqft x neighborhood), polynomial terms, or tree-based models.
Examples:
- Removing zipcode reduces multicollinearity and improves generalization.
- Adding "age of house at sale" captures depreciation and increases accuracy.
Confusion Matrix and Classification Metrics
A confusion matrix shows true positives, true negatives, false positives, and false negatives. It helps evaluate trade-offs for threshold tuning and costs.
Metrics
- Precision: of predicted positives, how many are correct.
- Recall: of actual positives, how many were caught.
- F1: harmonic mean of precision and recall.
- ROC-AUC: probability a random positive ranks above a random negative.
Examples:
- In fraud detection, favor recall to catch more fraud, but monitor precision to avoid customer friction.
- In email classification, favor precision to avoid mislabeling important messages as spam.
Ethics, Privacy, and Responsible AI
Build systems that respect users. Bias in data leads to biased outcomes. Transparency builds trust. Privacy must be designed in from the start.
Key considerations
- Data minimization: collect only what you need.
- Anonymization and pseudonymization for sensitive data.
- Fairness testing across demographic slices; avoid disparate impact.
- Explainability for high-stakes decisions.
Examples:
- Audit a credit scoring model for equal opportunity across protected groups; adjust thresholds per group to equalize error rates if policy requires.
- For web scraping, respect rate limits, identify as a bot, and avoid scraping content behind authentication without permission.
MLOps in Practice: From Notebook to Production
Automation
- Build pipelines for ingest, validation, training, testing, and deployment.
- Use CI to run unit tests for data transforms and model interfaces.
Monitoring
- Data drift: input distribution changes; Model drift: relationship between inputs and target changes.
- Alerting triggers: performance below threshold, input schema violations, or feature missingness spikes.
Retraining
- Schedules (e.g., weekly) plus event-driven retrains when metrics degrade or new data arrives.
Examples:
- A lending model monitors shifts in employment types; retraining occurs when the share of gig workers rises beyond a threshold.
- A recommendation system monitors CTR; if it falls, the pipeline rolls back to a previous model while retraining kicks off.
Advanced Practical Topics You'll Encounter
Data Versioning
Keep immutable snapshots of training and evaluation datasets. Store metadata: source, time frame, schema, feature lineage.
Experiment Tracking
Record model hyperparameters, code versions, data versions, metrics, and artifacts. This makes results repeatable and comparable.
Serving Patterns
- Batch predictions: nightly scoring for CRM campaigns.
- Real-time: low-latency APIs for fraud, pricing, and personalization.
- Streaming: model inference on event streams for instant action.
Examples:
- Use MLflow to compare hundreds of experiments for churn and promote the best to a model registry.
- Containerize a TensorFlow model with a REST endpoint using TensorFlow Serving and deploy behind an autoscaling layer.
Natural Language Processing: From Rules to Deep Models
Classical NLP Pipeline
- Preprocess: normalize case, punctuation, and accents.
- Represent: Bag-of-Words or TF-IDF for quick baselines.
- Model: Naive Bayes or Linear SVM for fast, strong results on many tasks.
Modern NLP
- Use embeddings and transformer architectures for context-aware understanding; fine-tune on your domain to reach production-grade accuracy.
Examples:
- Customer support triage: classical pipeline for speed and interpretability; escalate to deep models if accuracy needs aren't met.
- Sentiment tracking for product launches: start with Logistic Regression + TF-IDF, then fine-tune a transformer for nuance like sarcasm.
Time Series: Forecasting and Anomaly Detection
Workflow
Decompose to inspect trend and seasonality, test stationarity, difference if needed, fit ARIMA/SARIMA, and validate with rolling forecasts.
Anomaly Detection
- Use residuals from forecasts to flag unexpected spikes or drops.
- Complement with isolation forests or robust statistical thresholds.
Examples:
- Detect anomalies in hourly energy consumption to find faulty meters.
- Forecast inventory to set reorder points with service-level targets.
Case Study Sprints You Can Recreate
Fraud Detection Sprint
Data: transactions with labels. Steps: clean, feature engineer (velocity features, device fingerprints), model with gradient boosting or Random Forest, evaluate with ROC-AUC and cost-sensitive thresholds, deploy real-time API with asynchronous review queue.
Medical Imaging Sprint
Data: labeled images. Steps: augment images, start with a pre-trained CNN, fine-tune, calibrate thresholds to optimize sensitivity, and add human-in-the-loop review for borderline cases.
Examples:
- Build a pipeline to compute per-user transaction frequency and amount z-scores to feed the classifier.
- Use Grad-CAM to visualize which image regions contribute most to CNN decisions for clinical review.
Recommendations for Action: People, Schools, Organizations
For Aspiring Professionals
- Learning path: Python, SQL, and foundational math/stats; then scikit-learn; then TensorFlow; then MLOps basics.
- Build a portfolio: pick public datasets that tie to business questions; write clear readme files with problem framing and outcomes.
- Use Git for version control: branch, commit often, write meaningful messages; open-source parts of your work when possible.
Examples:
- Publish a churn prediction project with a live demo API and a dashboard showing uplift scenarios.
- Contribute to a Kaggle competition with a documented pipeline and error analysis notebook.
For Educational Institutions
- Integrate computer science, statistics, and domain courses; emphasize real datasets and stakeholder communication.
- Make project-based learning the norm; partner with industry for capstones.
Examples:
- A curriculum pairing probability theory with hands-on A/B testing labs.
- Multidisciplinary projects where students build a model, deploy it, and present business implications.
For Organizations
- Invest in robust data infrastructure: quality, lineage, governance, and access control.
- Adopt MLOps: standardize pipelines, model registries, monitoring, and retraining routines.
- Build a data-literate culture: train staff to read metrics, question assumptions, and use dashboards.
Examples:
- Implement feature stores to reuse vetted features across teams and models.
- Set SLOs for model latency, availability, and accuracy; monitor and enforce them like any critical service.
Authoritative Ideas Reframed
- Systems learn when their performance on a task improves with experience. That's the operational definition of ML you can test.
- Entropy quantifies uncertainty; decision trees split to reduce entropy. Information Gain measures how much a split reduces that uncertainty.
- Supervised learning maps inputs X to outputs Y by learning a function Y = f(X). The better the mapping generalizes to new data, the more useful the model.
Examples:
- Monitor a model's learning by plotting performance versus training steps; improvement indicates learning from experience.
- Evaluate a decision tree's splits by computing entropy before and after; pick the split with the highest information gain.
Hands-On: Two Beginner-Friendly Projects
Project 1: Spam Classifier
Goal: classify emails as spam or not spam.
Steps: collect labeled emails, preprocess text (tokenize, lowercase, remove stopwords), represent with TF-IDF, train Naive Bayes and Logistic Regression, compare F1 and ROC-AUC, tune thresholds for desired precision.
Deployment: wrap the final model as a REST API; log predictions for ongoing evaluation.
Examples:
- Add character-level n-grams to capture obfuscated words like "fr33" or "cl1ck".
- Use calibration plots to ensure predicted probabilities reflect true likelihoods.
Project 2: Demand Forecasting
Goal: forecast daily orders for inventory planning.
Steps: aggregate time series per SKU, decompose trend/seasonality, difference for stationarity, fit SARIMA, evaluate with walk-forward validation, add holiday/event regressors.
Deployment: schedule a nightly forecast job; write outputs to a table used by replenishment systems.
Examples:
- Incorporate price and promotion flags as exogenous regressors to improve accuracy.
- Set anomaly alerts when actuals deviate from forecast beyond tolerance bands.
Your Toolbelt: Libraries and Platforms
- Python: NumPy, Pandas, Matplotlib, Seaborn for analysis and viz.
- scikit-learn: classic ML algorithms and pipelines.
- TensorFlow/Keras: deep learning at scale; Keras for a clean API.
- NLTK: foundational NLP tasks; pair with scikit-learn or TensorFlow for modeling.
- Data: SQL databases, data warehouses; CSV/Parquet for files; APIs for external data.
- Dev: Git for version control; notebooks for exploration; scripts and modules for production; Docker for packaging.
Examples:
- Build a scikit-learn Pipeline that standardizes features, selects top k by mutual information, and fits Logistic Regression.
- Train a Keras model with early stopping and ModelCheckpoint callbacks to save the best weights.
Working with Real Data: Tips That Save Projects
- Create a data dictionary: document every feature, type, and meaning.
- Lock schemas: unexpected changes break pipelines; validate and alert on schema drift.
- Set baselines early: avoids illusion of progress.
- Guard against leakage: ensure transformations don't peek at the target or future information.
- Prefer simple models that meet the metric over complex ones that you can't deploy or explain.
Examples:
- Add a Great Expectations suite to validate non-null constraints and value ranges per column.
- Compare a boosted-tree classifier against a calibrated Logistic Regression; choose the latter if it's close in performance and easier to maintain.
The Reality of Data Work: Most Time Spent Before Modeling
Data acquisition and preparation can consume the majority of a project's time. The model's ceiling is set by data quality. Better data beats fancier algorithms.
Examples:
- Cleaning mismatched time zones and duplicated ids unlocks performance gains that tuning couldn't achieve.
- Reframing the target (e.g., predicting "churn in 60 days" instead of "ever churn") yields a model that drives timely action.
Scaling Yourself: How to Learn and Advance
- Practice with real datasets: Kaggle, public APIs, internal logs.
- Read model cards and papers slowly,implement small parts to learn deeply.
- Communicate: your ability to translate metrics into decisions builds trust and influence.
Examples:
- Publish "before/after" business metrics for your model's rollout (e.g., revenue lift per cohort).
- Start a habit of weekly write-ups: what you tried, what worked, what didn't, next steps.
Study and Practice Prompts
Concept checks
- Explain the difference between AI, ML, and DL to a non-technical colleague.
- Contrast supervised, unsupervised, and reinforcement learning, with examples from your domain.
Applied drills
- Implement gradient descent on a synthetic regression dataset and compare to scikit-learn's solution.
- Write a SQL query for a 7-day rolling average and validate edge cases.
Examples:
- Build a confusion matrix by hand for a small classification set to ensure metric literacy.
- Create a walk-forward validation loop for a time series and compare it to random splits to see why random splits mislead.
Covering Every Key Takeaway from This Course
- Data Science is a process: collection, cleaning, modeling, deployment, and monitoring,not a single algorithm.
- Data preparation is paramount: expect to invest most of your time here; quality in equals quality out.
- Model choice depends on the problem and data: no universal winner; pick tools that fit constraints and objectives.
- Deep learning excels with complex, high-dimensional data when you have the volume and compute to train it well.
- Foundational math is non-negotiable if you want to debug and explain models confidently.
- MLOps turns prototypes into durable assets: automation, reproducibility, monitoring, and retraining create reliable value.
- Data continues to explode in volume: mastering these methods will keep compounding your capability and career.
Examples:
- Replacing a brittle spreadsheet-based forecast with a monitored time series model that triggers retraining when drift is detected.
- Using PCA to compress features for a fast, interpretable model that meets latency and accuracy targets.
Frequently Asked Pitfalls and How to Avoid Them
- Training-serving skew: features computed differently in production vs. training; fix by sharing a single feature pipeline.
- Leakage: target info sneaks into features; fix by aligning feature windows relative to the prediction point.
- Metric myopia: optimizing offline accuracy but not business outcomes; fix by defining cost-weighted metrics and decision thresholds early.
Examples:
- A churn model that used post-churn support ticket counts looked great offline but failed in production; removing leak restored honest performance.
- A fraud model improved AUC but increased false positives; recalibrating the threshold and adding a review step reduced customer friction.
Put It All Together: A Mini Roadmap to Mastery
Phase 1: Foundations,Python, SQL, stats/probability, EDA, simple ML with scikit-learn.
Phase 2: Projects,classification, regression, clustering; build end-to-end pipelines with clear problem statements.
Phase 3: Deep Learning,TensorFlow/Keras; pre-trained models; fine-tuning; learn serving basics.
Phase 4: MLOps,versioning, CI/CD, model registries, monitoring, and retraining; ship real value.
Phase 5: Specialize,NLP, time series, recommender systems, or computer vision depending on your domain.
Examples:
- Build a portfolio with three projects: spam detection, house price regression, and demand forecasting; each with a deployed artifact and write-up.
- Add one MLOps-focused project: a scheduled pipeline that trains a model, pushes it to a registry, and deploys a canary release with monitoring.
Conclusion: Make the Work Real
This course gave you the complete stack: definitions with clarity, math with purpose, SQL for data access, web scraping for acquisition, EDA for understanding, supervised/unsupervised/reinforcement learning for modeling, core algorithms for most use cases, deep learning for complex patterns, NLP and time series for specialized data, and MLOps to carry your work into production and keep it healthy. The thread tying it together is a disciplined lifecycle and the mindset to ship. Don't stop at a clean notebook. Pick a problem that matters, define a success metric, get the data, and build the smallest system that works. Deploy it. Monitor it. Iterate. That loop is where you compound your skills, your portfolio, and your outcomes.
Final prompts to act:
- Select a business problem this week, build a baseline model in two days, and measure it against a clear metric.
- Wrap the best model in a simple API, add minimal logging, and share it with a trusted user for feedback. Iterate from there.
Frequently Asked Questions
This FAQ is a practical reference for learners and business professionals who want clear answers about Data Science and AI. It organizes common questions from basics to deployment so you can make smart decisions, avoid rework, and move projects forward with confidence. You'll find concise explanations, real-world examples, and actionable tips that tie concepts to outcomes,so you can apply what you learn, not just memorize terms.
Foundations of Data Science and AI
What is Data Science?
Simple idea:
Data Science turns raw data into useful decisions through collection, cleaning, analysis, visualization, and predictive modeling. It mixes statistics, programming, and domain insight to answer practical questions.
Why it matters:
Teams use it to forecast demand, reduce risk, and personalize experiences. Think of it as a repeatable process that converts messy data into business leverage.
Example:
Route planning apps pull location signals from millions of devices, model traffic patterns, and suggest the fastest path while predicting arrival times. The pipeline spans ingestion to modeling and real-time serving.
What is Artificial Intelligence (AI)?
Definition:
AI is the field of building systems that can learn, reason, plan, and interact with language or visuals,tasks we associate with human intelligence.
What it includes:
Rule-based systems, machine learning, deep learning, and modern language models all sit under AI. These systems automate perception, prediction, and decision-making at scale.
Example:
Voice assistants parse speech, interpret intent, and trigger actions like sending messages or setting reminders. Behind the scenes: speech recognition, natural language understanding, and dialogue management.
Certification
About the Certification
Get certified in Data Science & AI. Prove you can clean messy data, use SQL and web scraping, build TensorFlow ML and deep learning models, run NLP and time series, deploy and monitor MLOps pipelines, and deliver results across industries.
Official Certification
Upon successful completion of the "Certification in Building and Evaluating TensorFlow ML & Deep Learning Models", you will receive a verifiable digital certificate. This certificate demonstrates your expertise in the subject matter covered in this course.
Benefits of Certification
- Enhance your professional credibility and stand out in the job market.
- Validate your skills and knowledge in cutting-edge AI technologies.
- Unlock new career opportunities in the rapidly growing AI field.
- Share your achievement on your resume, LinkedIn, and other professional platforms.
How to complete your certification successfully?
To earn your certification, you’ll need to complete all video lessons, study the guide carefully, and review the FAQ. After that, you’ll be prepared to pass the certification requirements.
Other AI Video Courses
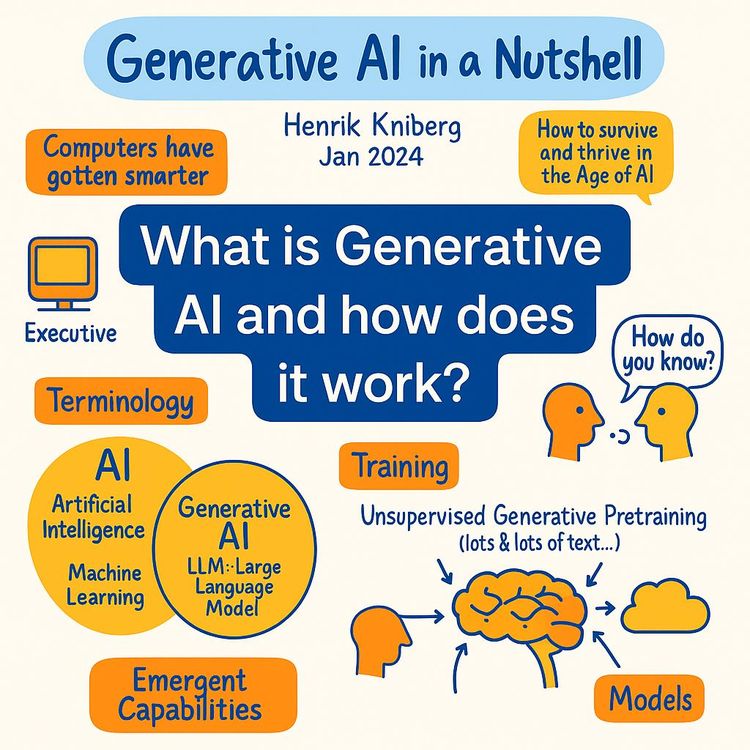
Video Course: What is Generative AI and how does it work?

Video Course: How to Use ChatGPT from Beginner to Professional

Video Course: How to Use Google Gemini for Google Workspace to Boost Productivity

Video Course: How to Use Claude 3.7 AI - Tips for Beginners!
Video Course: ChatGPT for Data Analytics: Full Course - from Beginners to Professional

Video Course: Generating Images and photos With ChatGPT?

Video Course: Generating Images & Photo's with MidJourney
Video Course: Generating Design's with Microsoft Designer and AI

Video Course: Generating Design's with Canva.com and AI
Join 20,000+ Professionals, Using AI to transform their Careers
Join professionals who didn’t just adapt, they thrived. You can too, with AI training designed for your job.