MCP server · Developer tools
Embedded Debugger MCP server
by adancurusul
Lets your AI talk to a hardware debug probe so it can inspect, halt, and flash a microcontroller for you.

This is a helper program for people who work with small computer chips, the kind inside circuit boards. It connects your AI assistant to a hardware debug probe, the little device you plug between your computer and the chip. If you write or test firmware for chips like ARM Cortex-M or RISC-V, this can save you a lot of clicking around in separate tools.
What is an MCP server? The 30-second version
On its own, your AI can only chat with you. An MCP server is a small helper program that gives your AI a new skill or a connection to something outside the chat. This one connects your AI to a debug probe and the chip it is attached to, so the AI can look at the chip, stop it, read its memory, or load new firmware when you ask. You still need the probe and the chip wired up; the server is the bridge between your AI and that hardware.
What this MCP server does
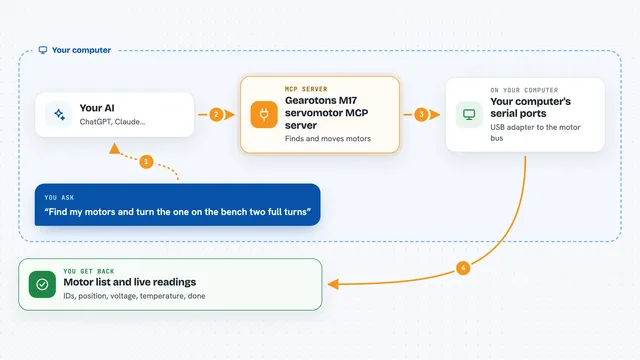
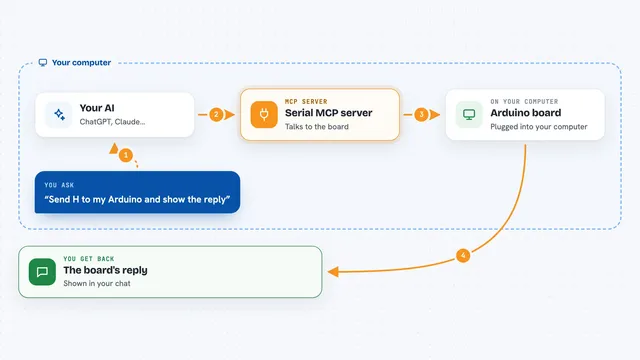
You ask your AI something about your chip, like what is connected or what went wrong. The AI uses this helper program, which talks to your debug probe through a tool called probe-rs, or through OpenOCD if you use that instead. The probe then talks to the chip on your desk. The result comes back into your chat as a list, a status, some numbers, or a short report. For crashes, it can read the chip's fault registers and try to point at the line of code that failed.
 Click to zoom
What you can do with it
- List the debug probes plugged into your computer
- Connect to a specific chip and start a session
- Halt, run, step, or reset the chip
- Read and write memory on the chip
- Set and clear hardware breakpoints
- Flash new firmware onto the chip
- Read live debug messages over RTT
- Diagnose a crash and map it back to source lines
Try asking your AI
- “List the debug probes connected to my computer”
- “Connect to my STM32 board and tell me the core status”
- “Halt the chip and read the fault registers so we can see what crashed”
- “Flash this firmware file onto the board and then run it”
What it gives back to you
You get answers in the chat: a list of probes, a session status, memory values, register contents, or a short structured report of fault bits. For a crash, it can give you a stack trace with function names and file and line numbers, if your firmware was built with debug info. When you flash firmware, it tells you whether the write and verify succeeded. It reports what it found; it does not guess the root cause for you.
Before you start
What you need
- A debug probe that works with probe-rs, such as ST-Link, J-Link, DAPLink, or Black Magic Probe
- A supported chip wired up over SWD or JTAG
- The Rust toolchain installed so you can build the server
- For the OpenOCD option, a running openocd with its GDB port open
Good to know
It can change your hardware: it can erase and rewrite flash, and write to memory, so make sure you point it at the right board and keep the safety settings in the config as they are until you trust it.
Install it with your AI
Add Embedded Debugger MCP server to your AI, no technical skills needed
You don't install anything by hand. You copy one prompt, paste it into an AI that can work on your computer, and it checks, installs and connects the server for you, asking you when it needs something.
Sign in to get the install prompt
Members get a ready-made prompt that lets the Claude desktop app check Embedded Debugger MCP server, install it and connect it for them, step by step. You don't need any technical skills: you copy, paste and answer a few questions. Your connected AI can also find and install any of the 4,361 MCP servers here for you.
Who it's for
Embedded developers and firmware engineers who debug ARM Cortex-M or RISC-V boards and want their AI assistant to help drive the probe.