MCP server · Health and learning
SuperGlookoQuery
by sikcapri
Ask Claude about your Glooko diabetes data: time in range, GMI, trends and insulin doses.
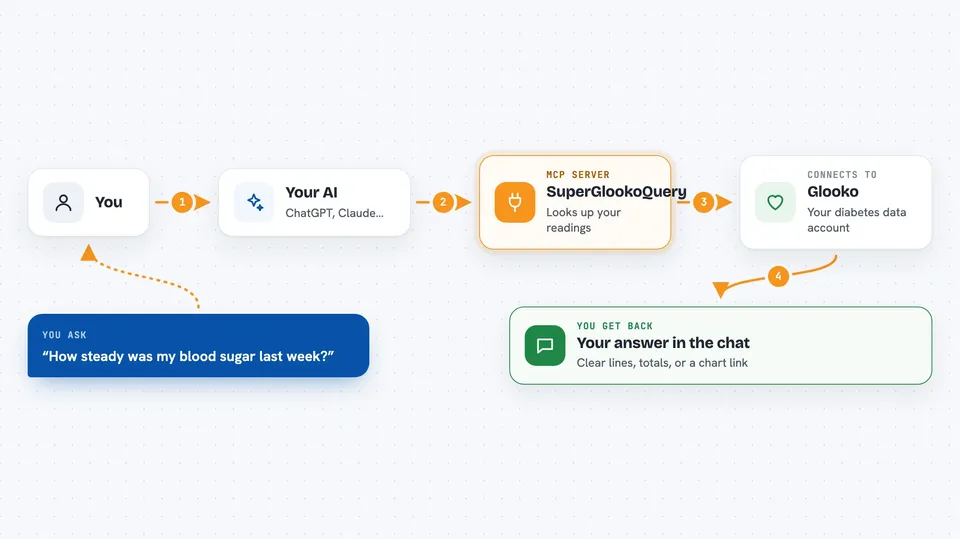
SuperGlookoQuery lets you talk to Claude Desktop about your own diabetes data sitting in Glooko. Instead of scrolling charts yourself, you ask a normal question and get an answer pulled from your history right in the chat. Handy if you wear a pump or a sensor and want clearer patterns before your next clinic visit.
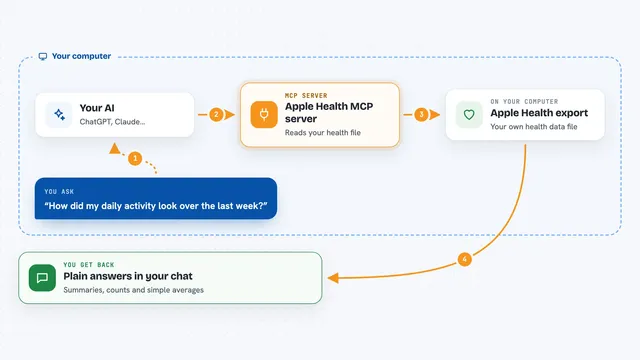
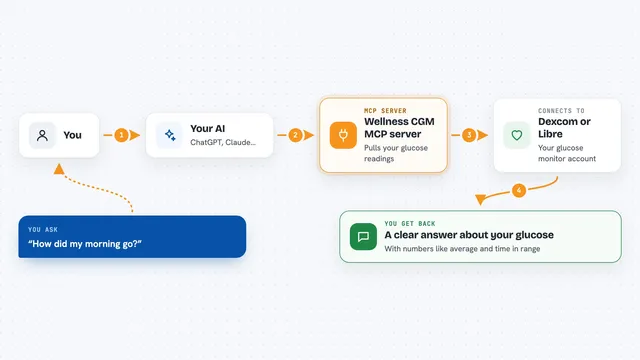
What is an MCP server? The 30-second version
On its own, your AI can only chat with you based on what you type. An MCP server is a small helper program that plugs into your AI and gives it a new ability. Here, that helper sits inside Claude Desktop and connects to your Glooko diabetes data. Once installed, Claude can quietly look things up in your records whenever you ask a related question.
What this MCP server does
When you connect it, the helper signs in to your Glooko account and downloads your recent pump and sensor history onto your own computer. Then each time you ask something like "how did I sleep" or "was yesterday steady", Claude picks the matching little lookup behind the scenes and brings back the result. For bigger picture stuff such as time in range or average sugar, it adds those figures together for the period you mention. When a question really needs detail, it digs down to individual five minute readings. Either way, you simply see the answer appear in the same chat box you were typing in.
 Click to zoom
What you can do with it
- Check your time spent in your target blood sugar range for any week or month
- See your estimated overall control figure across a chosen stretch of time
- Spot your steadiest and shakiest times of day and worst nights
- Compare how much background versus meal-time insulin went in during a period
- Look at meals and corrections alongside nearby readings to spot repeated misses
- Open a proper coloured glucose chart showing highs, lows and dose marks
Try asking your AI
- “Give me a summary of my last two weeks”
- “Was I more stable in July or August”
- “Show me my daily pattern for breakfast time”
- “Which night had the biggest dip?”
What it gives back to you
For simple checks you usually receive a couple of clear lines answering your question, sometimes with totals worked out for the dates involved. Longer stretches come back grouped per day along with averages and counts of high or low moments. Asking specifically for a graph produces a link taking you to a webpage view containing the drawn curves. Behind the scenes plenty else stays saved within the application ready for follow-up queries later.
Before you start
Good to know
Your sign in details travel straight to glooko while results remain upon your personal computer although conversations happen against anthropics systems possibly retaining parts.
Install it with your AI
Add SuperGlookoQuery to your AI, no technical skills needed
You don't install anything by hand. You copy one prompt, paste it into an AI that can work on your computer, and it checks, installs and connects the server for you, asking you when it needs something.
Sign in to get the install prompt
Members get a ready-made prompt that lets the Claude desktop app check SuperGlookoQuery, install it and connect it for them, step by step. You don't need any technical skills: you copy, paste and answer a few questions. Your connected AI can also find and install any of the 4,361 MCP servers here for you.
Who it's for
People living with type 1 or similar conditions whose pumps or sensors feed information into Glooko regularly.