MCP server · Developer tools
qwen-dap-mcp debugger server
by SLP-DEV1
Lets your AI attach a real debugger to a crashing program and read what actually happened at runtime.
This is a helper that gives your AI assistant a real debugger for programs written in languages like C and C++. It is meant for people who deal with crashes, freezes, or strange values in compiled software and want the AI to look at the live program instead of just the source code. If you only write scripts or web pages, you probably will not need it.
What is an MCP server? The 30-second version
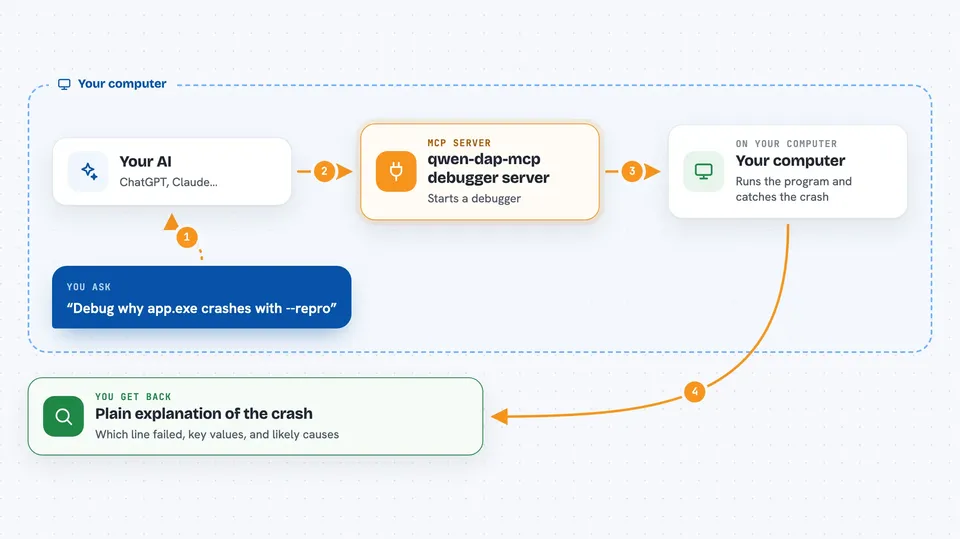
On its own, your AI can only read text and chat with you. An MCP server is a small helper program that gives your AI one extra skill. This helper connects your AI to a debugger (a tool that watches a running program and shows what it is doing inside). Once it is connected, your AI can ask the debugger to look at a crashing program and report back what it found.
What this MCP server does
You tell your AI something like: debug why this program crashes. Your AI asks this helper to start a debugger on that program. The helper runs the program, catches the crash, and collects details like which line failed, what values were in memory, and which part of the code was running. It then hands all of that back to your AI, which explains it to you in plain words and can suggest a fix.
 Click to zoom
What you can do with it
- Diagnose why a native program crashes and point at the likely line
- Find out why a program hangs or freezes, including deadlocks
- Compare a good run and a bad run to spot what changed
- Trace which piece of code writes a suspicious value
- Open a crash dump file from Windows or Linux and inspect it
- Attach to a program running on another machine over the network
- Verify that a fix actually removes the original crash
Try asking your AI
- “Debug why app.exe crashes when I run it with --repro”
- “My program freezes after a few seconds, find out why”
- “Compare this crashing run with the working one from yesterday”
- “Open the crash dump at C:/dumps/app.dmp and tell me what happened”
What it gives back to you
You get back a written explanation in the chat: which function crashed, which line, the values of key variables, and often a short list of suspects. For hangs, you get a list of threads and what each one was waiting on. For comparisons, you get a short summary of the differences that matter. It does not edit your code; your AI does that separately with its normal tools.
Before you start
What you need
- Node.js 20 or newer installed on your computer
- A debugger adapter installed, such as CodeLLDB, lldb-dap, or GNU GDB 14 or newer
- The program you want to debug, ideally built with debug symbols
- An MCP client that can run local servers, such as Qwen Code or the Claude desktop app
Good to know
A debugger can start, pause, and change a running program, so only point it at programs you are allowed to debug, and be careful with remote targets.
Install it with your AI
Add qwen-dap-mcp debugger server to your AI, no technical skills needed
You don't install anything by hand. You copy one prompt, paste it into an AI that can work on your computer, and it checks, installs and connects the server for you, asking you when it needs something.
Sign in to get the install prompt
Members get a ready-made prompt that lets the Claude desktop app check qwen-dap-mcp debugger server, install it and connect it for them, step by step. You don't need any technical skills: you copy, paste and answer a few questions. Your connected AI can also find and install any of the 4,609 MCP servers here for you.
Who it's for
Developers and engineers who work with compiled programs in C, C++, Rust, or similar languages and need help chasing crashes, freezes, or memory problems.