AI app for education · no coding needed
Role-based data visualization and course authoring workbench
Reduce tool sprawl and manual rebuild work while keeping learner data and course branding under the institution's control.
Made for: Course authors, instructors and training teams producing data-driven lessons and interactive calculators
What it does for you
The problem
Course teams assemble charts, calculators and course pages in separate subscriptions, then rebuild them by hand for each cohort.
What it gives you
Reviewed charts, interactive calculators and course pages linked to learner progress records
What you give it
Uploaded datasetsscreenshotsweb sourcestext promptscourse outlines
Build your own version of CalcGen AI, Graphy AI and more
One app with what these 7 AI tools do, yours to keep and change: CalcGen AI, Graphy AI, MagicChart, VibeChart, Visuals, DataSquirrel.ai, Quadratic AI.
Everything these tools do, in one app
- AI chart generation Creates charts and graphs automatically from simple text prompts or natural language queries.Found in CalcGen AI, MagicChart, VibeChart and 1 more
- Data file upload Lets users upload data files such as CSV or Excel to generate visualizations.Found in CalcGen AI, VibeChart, Visuals
- Screenshot data extraction Extracts data automatically from uploaded screenshots for visualization.Found in CalcGen AI
- Web data sourcing Researches and retrieves data from the web to build charts with cited sources when user data is unavailable.Found in CalcGen AI
- Interactive graphing calculator Allows users to input equations and specify variables to create custom graphing calculators.Found in CalcGen AI
- Community showcase Provides a space where users can share and draw inspiration from others' creations.Found in CalcGen AI
- Course creation tools Enables building online courses with multimedia support including video, audio, and quizzes.Found in Graphy AI
- Community building features Offers discussion forums and live chat to enhance learner interaction.Found in Graphy AI
- Customizable templates and branding Provides templates and branding options to maintain a consistent look and feel.Found in Graphy AI
- Learner analytics Tracks learner progress and engagement metrics through integrated analytics.Found in Graphy AI
- Flexible monetization options Supports subscriptions, one-time payments, and bundles for selling courses.Found in Graphy AI
- One-click download Allows downloading generated charts with a single click for easy sharing.Found in MagicChart
- Unlimited free chart creation Enables creating an unlimited number of charts at no cost.Found in MagicChart
- Simple interface Offers a clean and intuitive interface suitable for users of all skill levels.Found in MagicChart, VibeChart
- AI-driven data transformation Transforms text or data into visual formats using AI.Found in VibeChart
- Automatic chart type suggestions Analyzes data structure and suggests optimal chart types.Found in Visuals
- Clarifying questions Asks 1-3 clarifying questions to refine the generated output.Found in Visuals
- Large dataset handling Handles large datasets using intelligent sampling and binning strategies.Found in Visuals
- Multiple export formats Exports charts in formats such as PNG, SVG, CSV, and interactive visuals.Found in Visuals, Quadratic AI
- Automated data cleaning Automatically cleans and preprocesses data to save time on preparation steps.Found in DataSquirrel.ai
- Customizable dashboard Provides an intuitive dashboard with customizable visualizations and real-time updates.Found in DataSquirrel.ai
- Natural language queries Allows users to ask questions about their data in natural language.Found in DataSquirrel.ai
- Data source integrations Integrates with popular data sources and file formats for seamless import and export.Found in DataSquirrel.ai
- Predictive analytics Offers advanced predictive analytics and trend forecasting capabilities.Found in DataSquirrel.ai
- Equation solving Automatically solves quadratic equations with step-by-step explanations.Found in Quadratic AI
- Customizable workflows Allows creating customizable workflows for different analysis scenarios.Found in Quadratic AI
- Cloud-based collaboration Enables collaboration across teams through a cloud-based platform.Found in Quadratic AI
How it works, step by step
- Generate charts from text prompts or natural language queries
- Upload CSV or Excel files for visualization
- Extract data from uploaded screenshots
- Retrieve web data with cited sources when user data is unavailable
- Build interactive graphing calculators from equations and variables
- Share creations in a community showcase
- Author courses with video, audio and quizzes
- Run discussion forums and live chat for learners
- Apply customizable templates and branding
- Track learner progress and engagement analytics
- Support subscriptions, one-time payments and bundles
- Download generated charts in one click
- Create charts without per-chart limits
- Provide a clean interface for all skill levels
- Transform text or data into visual formats with AI
- Suggest optimal chart types from data structure
- Ask 1-3 clarifying questions to refine output
- Handle large datasets with sampling and binning
- Export PNG, SVG, CSV and interactive visuals
- Clean and preprocess data automatically
- Provide a customizable dashboard with real-time updates
- Answer natural language questions about data
- Integrate with common data sources and file formats
- Offer predictive analytics and trend forecasting
- Solve quadratic equations with step-by-step explanations
- Support customizable analysis workflows
- Enable cloud-based team collaboration
- Compare the reviewed result with the recorded baseline and value assumptions
- Capture corrections and named-owner approval before consequential use
- Export a versioned reviewed charts, interactive calculators and course pages linked to learner progress records with source references and unresolved questions
Jobs this app suits
Our AI checked this app against 500 jobs; these get the most out of it. Each job links to its learning path.
Build it yourself with your AI system
Build this app yourself, no coding needed
Start with a quick version you can try in a few minutes. Like it? Then build the full app by copying and pasting our step-by-step instructions: everything is prepared for you.
Sign in to see how to build it yourself
Build a quick version to try, or get the full app pack for Role-based data visualization and course authoring workbench with the step-by-step building instructions. You don't need any technical skills: you copy, paste and answer a few questions. Both are included in the membership.
4 Have it built for you days to a few weeks
Rather not do it yourself, or want it fully tailored to your data, your way of working and your brand? Nexibeo builds Role-based data visualization and course authoring workbench with you.
What's in the app pack
Included in the Complete AI Training membership.
- The building instructions your AI follows, step by step
- The questions your AI will ask you about your business before it starts
- A clickable demo you can open in your browser, to see how it should work
- A detailed blueprint of the screens, the information it keeps and the checks it runs
Become a member to get the app packAlready a member? Sign in
The files, for the technically curious
- START-HERE.mdHow to build it with your own AI (read first)3 KB
- README.mdOverview and links5 KB
- questions.mdQuestions to answer before you build2 KB
- prompt-cloudflare.mdThe full build prompt, hosted on Cloudflare27 KB
- prompt-vps.mdThe same build on your own server (Docker)27 KB
- spec.jsonData model, API, AI pipeline, acceptance criteria13 KB
- demo/index.htmlThe working demo on sample data204 KB
Questions
Do I need to know how to code?
No. You copy and paste the prompts on this page into ChatGPT or Claude, and the AI does the building. When it asks you something, you answer in your own words.
What does it cost?
The quick version, the app pack and the step-by-step instructions are for members: you pay the membership price, not a price per app (see the plans). Building the full app uses your own ChatGPT or Claude subscription. Putting it online is often cheap or no cost at the start, and your AI tells you before anything costs money.
How long does it take?
The quick version: about two minutes. The real app: an afternoon for a first version you can use, longer if you want every feature.
Can I change it to fit my business?
Yes. Tell your AI what to change in plain words, like “add a column for the price” or “use our logo and colours”. Or have Nexibeo build and customise it for you.
More detailsHow the AI works, safeguards and what to build first
Reduce tool sprawl and manual rebuild work while keeping learner data and course branding under the institution's control. For course authors, instructors and training teams producing data-driven lessons and interactive calculators, convert uploaded datasets, screenshots, web sources and text prompts into reviewed charts, interactive calculators and course pages linked to learner progress records. The benefit is a testable hypothesis, measured through accepted lesson assets per authoring hour and learner completion of calculator exercises; do not assume that AI output alone produces business value.
Confirm the buyer's problem and scope, collect uploaded datasets, screenshots, web sources, text prompts and course outlines, then follow this sequence: 1. Generate charts from text prompts or natural language queries. 2. Upload CSV or Excel files for visualization. 3. Extract data from uploaded screenshots. 4. Retrieve web data with cited sources when user data is unavailable. 5. Build interactive graphing calculators from equations and variables. 6. Author courses with video, audio and quizzes. 7. Track learner progress and engagement analytics. Resolve uncertain cases with qualified reviewers, approve reviewed charts, interactive calculators and course pages linked to learner progress records, and measure accepted lesson assets per authoring hour and learner completion of calculator exercises against a documented baseline.
How the AI works
Use AI to interpret permitted inputs, suggest structured mappings and generate candidate outputs for the stated task modules. Use deterministic code for arithmetic, equation solving, schema validation, hard constraints and reproducible tests. Review source-linked explanations and uncertainty before accepting results. Instructor review and curriculum checks remain human. A model suggestion is never a verified fact, professional decision or authorization to act.
Safeguards
Preserve instructor voice, source attribution, data accuracy and usage permissions. Instructors approve substantive changes and publication scope. One course format and one approved data source; instructor review and curriculum checks remain human. Keep all consequential actions under authorized human control and do not fabricate missing inputs, permissions, professional judgments or market evidence.
What to build first
Pilot scope: One course format and one approved data source; instructor review and curriculum checks remain human. Implement one approved input format, a bounded representative case set and the first three task modules: generate charts from text prompts or natural language queries; upload CSV or Excel files for visualization; extract data from uploaded screenshots. Support the remaining modules with operator review: retrieve web data with cited sources; build interactive graphing calculators; author courses with video, audio and quizzes; track learner progress and engagement analytics. Include source references, corrections, basic organization access, approval states, export and value measurement. Use managed operator assistance for unresolved exceptions. The cost estimate covers this narrow prototype, not unrestricted multi-tenant scale, complex production integrations, specialist certification or physical operations.
What it can connect to
Institution-owned datasets, authorized course materials and permitted research sources. Cloud asset storage, design-file import/export and learning management system destinations. Start with file exchange and validate destination specifications before promising direct publishing. Start with authorized file exchange. Validate current provider access, usage rights and schema behavior before promising a connector.
The screens in detail
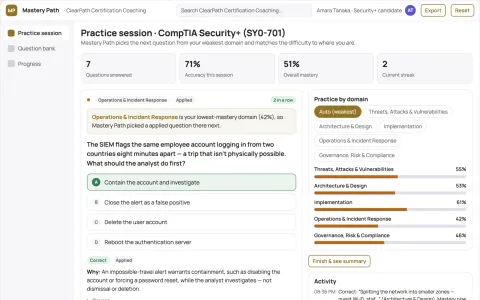
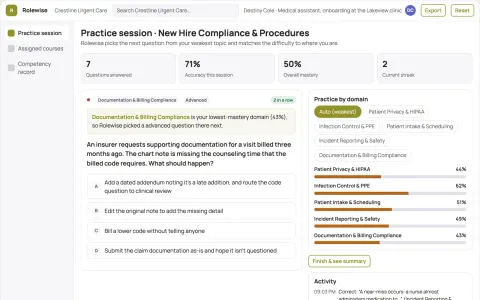
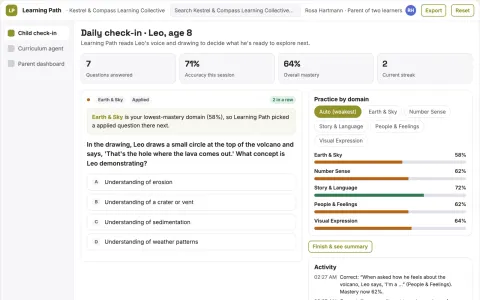
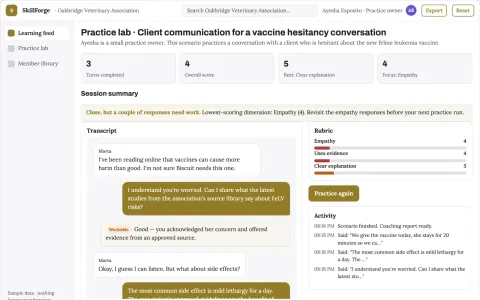
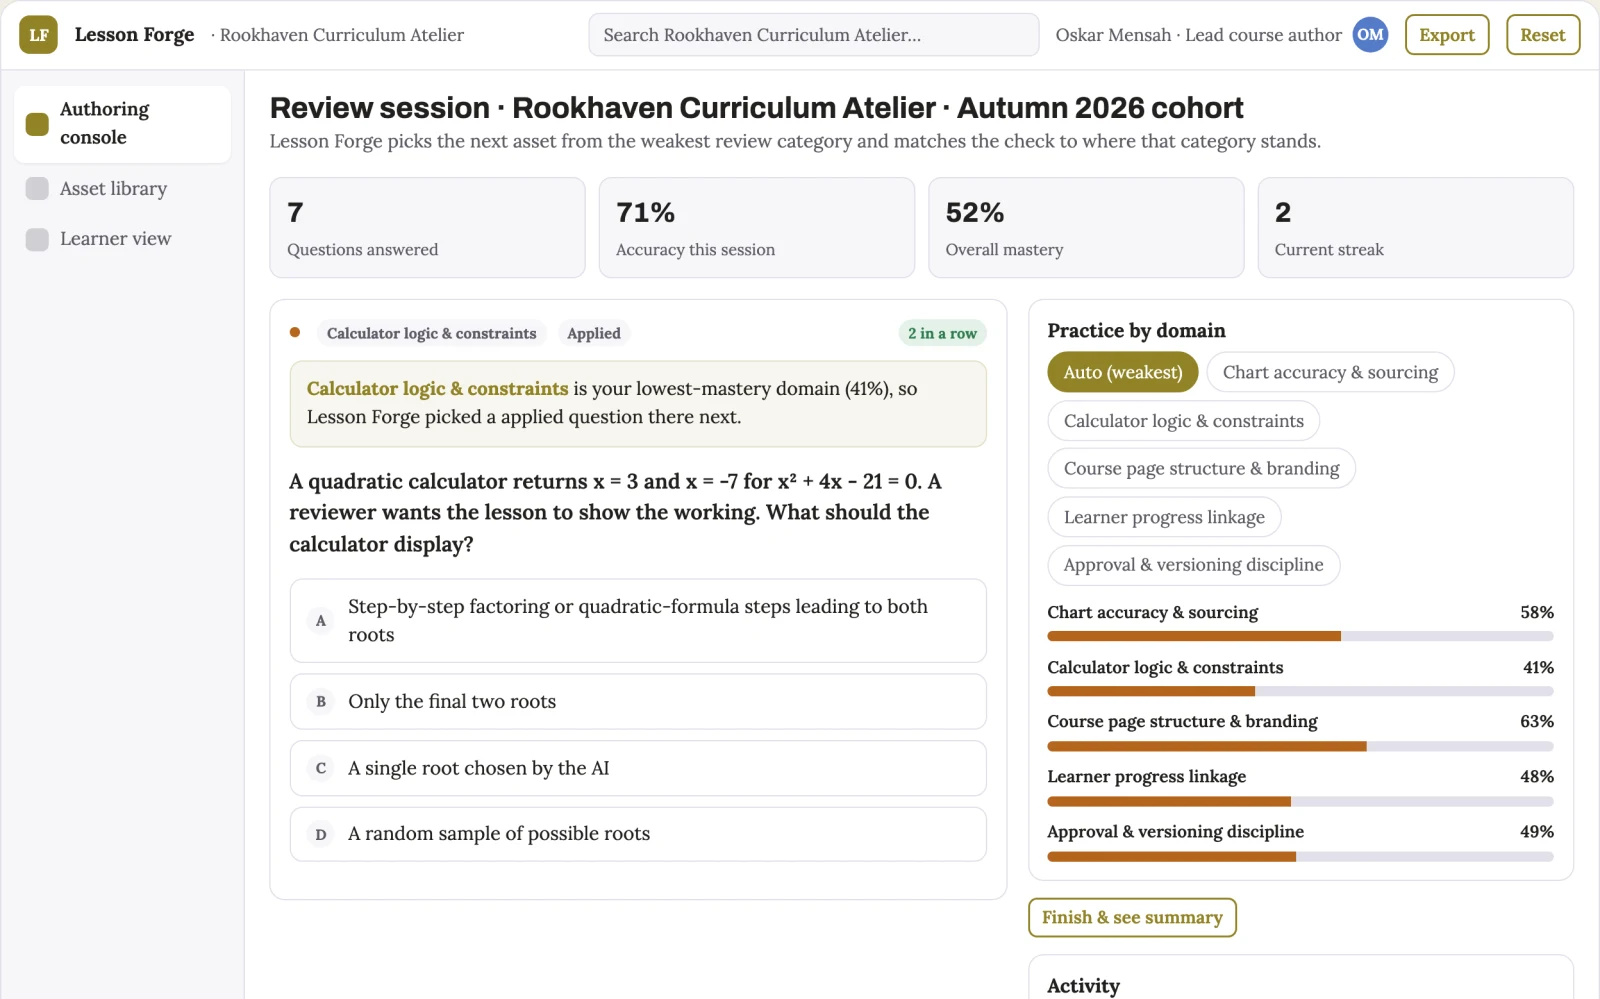
Primary screens: Course authoring console, Chart and calculator builder, Learner view and progress. Use a thumbnail gallery for courses and asset libraries, a large central editing canvas, and a right-hand panel for data sources, constraints and comments. Let users compare chart and calculator versions side by side. Display draft, changes requested and approved states. Provide a learner preview link with comments anchored to the relevant asset. Make the task-specific outcome reviewed charts, interactive calculators and course pages linked to learner progress records visible beside its evidence, review state and value baseline.