MCP server · Developer tools
dotnet-diagnostics MCP server
by aayushmdesai
Ask your AI to check a running .NET app for memory leaks, GC pressure and thread problems.
This is a small helper that lets your AI look inside a running .NET program and tell you what is going wrong. It is handy if you work with .NET apps and want plain answers about memory, garbage collection or slow threads without learning the command line tools. You point it at a process, ask a question, and get a real diagnosis.
What is an MCP server? The 30-second version
On its own, your AI can only chat. An MCP server is a small helper program that gives your AI a new skill or a connection to an app or service. This one connects your AI to any running .NET process on your machine, so it can read live runtime data like memory use, GC events and thread counts. You ask in normal words, and the AI uses this helper to fetch the numbers and explain them.
What this MCP server does
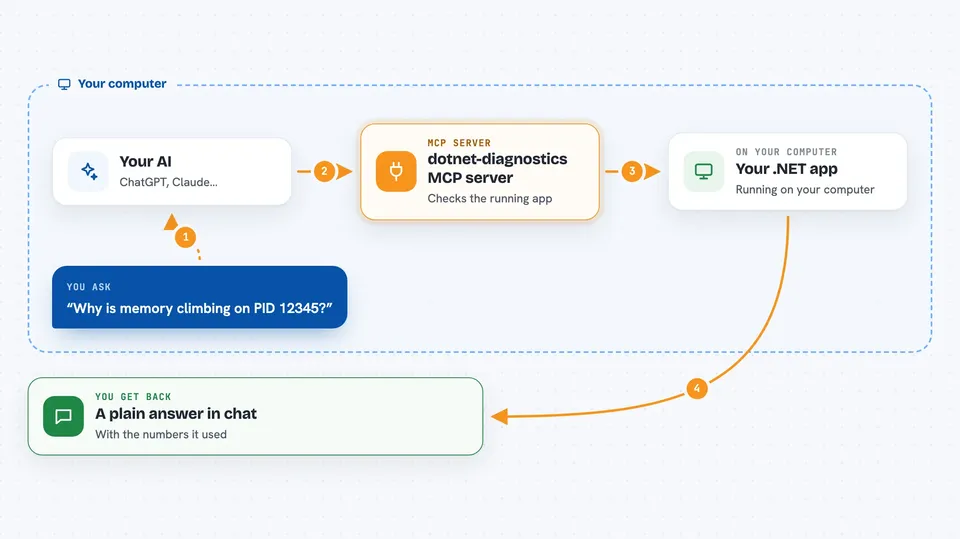
You ask your AI a question about a running .NET app, for example why memory keeps climbing. The AI picks the right tools from this server, such as checking the process, then reading memory stats, then looking at GC events. The server talks to the .NET runtime over a built-in channel and pulls back live numbers. The AI reads those numbers and tells you what is actually happening in plain language. You do not have to know which tool to call; the AI works that out from your question.
 Click to zoom
What you can do with it
- Check if a .NET process is reachable and see its name, PID, uptime and version
- Look at memory use, heap size, large object heap and fragmentation
- See a timeline of garbage collection events and why they happened
- Check thread pool counts, queue depth and lock contention
- Get a broad health snapshot of 27 runtime metrics at once
- Read runtime configuration and filtered environment variables
- List the raw counters available on a process you do not know
Try asking your AI
- “Do a full health check on PID 12345”
- “Why is memory climbing on PID 12345?”
- “Any thread starvation in PID 12345?”
- “What is the GC situation on PID 12345?”
What it gives back to you
You get answers in the chat, not raw files. The AI usually replies with a short diagnosis, for example that most GC events are Gen2 and triggered by large allocations, plus the numbers it used. Some tools return lists or tables, like a timeline of GC events or a snapshot of counters. You can then ask follow-up questions and the AI will dig further.
Before you start
What you need
- The .NET 8 SDK or later installed on your machine
- The Claude desktop app or another MCP-compatible client
- A running .NET process to inspect
- On macOS, your TMPDIR value set in the config (run echo $TMPDIR to find it)
Good to know
It reads live data from a running process, so make sure you are allowed to inspect that process and be careful about sharing environment details.
Install it with your AI
Add dotnet-diagnostics MCP server to your AI, no technical skills needed
You don't install anything by hand. You copy one prompt, paste it into an AI that can work on your computer, and it checks, installs and connects the server for you, asking you when it needs something.
Sign in to get the install prompt
Members get a ready-made prompt that lets the Claude desktop app check dotnet-diagnostics MCP server, install it and connect it for them, step by step. You don't need any technical skills: you copy, paste and answer a few questions. Your connected AI can also find and install any of the 4,361 MCP servers here for you.
Who it's for
Developers and support engineers who run .NET apps and want quick, plain answers about memory, GC and thread health.