MCP server · Finance and crypto · official
Quant Data market statistics
by celineycn · official
Lets your AI pull measured market statistics for stocks, ETFs and futures, and report them honestly.

Quant Data is a service that publishes measured market statistics for US stocks and ETFs, index futures, Hong Kong stocks and Chinese A-shares. This plugin connects that service to your AI assistant, so you can ask about things like breakout failure rates, volume waves, or options max pain and get real numbers back. It is handy if you follow markets and want a second, numbers-based view instead of opinions.
What is an MCP server? The 30-second version
On its own, your AI can only chat with you using what it already learned. An MCP server is a small helper that gives your AI a new skill or a connection to an outside service. This one connects your AI to Quant Data, so when you ask a market question, the AI can go and look up the statistics for you. You do not need to know how it works under the hood, you just ask in normal words.
What this MCP server does
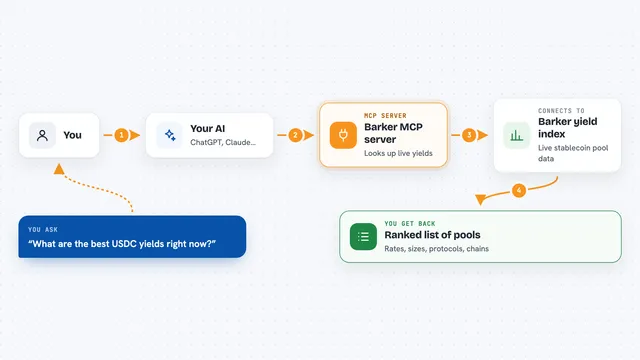
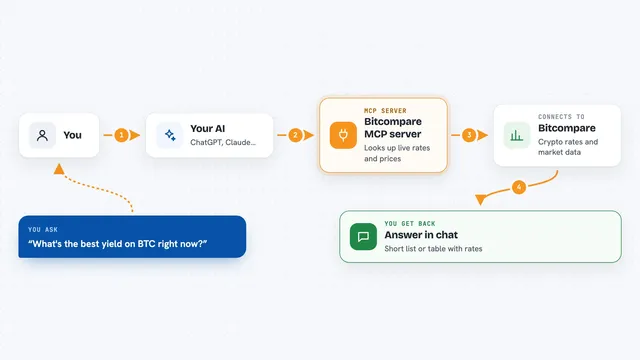
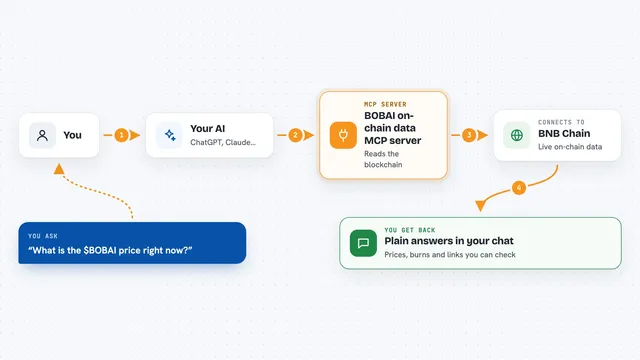
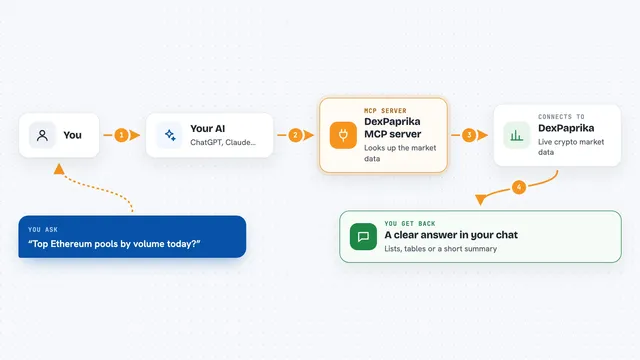
You ask your AI a question about a market, like how often a certain breakout fails or where options max pain sits for a ticker. The AI uses this helper to send your question to Quant Data. Quant Data runs its measurements and sends back numbers, event lists and short descriptions. The AI then explains those numbers to you in the chat, along with the disclaimer that comes with every response. Nothing is a buy or sell recommendation, it is just measured history.
 Click to zoom
What you can do with it
- Ask how often breakouts like the one you are watching have failed historically
- Check whether a pullback is happening on low volume
- Look up options max pain for a stock or ETF this week
- See which way dealer gamma is leaning on a ticker
- Get a day-type probability read for the US day session
- Compare an event win rate against its baseline
- Read the measured verdicts on famous price-action claims
Try asking your AI
- “Did ES=F just break out of its range, and how often did breakouts like this fail?”
- “Is the pullback in ES=F happening on low volume?”
- “Where is max pain for TSLA this Friday?”
- “Which way is dealer gamma leaning on NVDA?”
What it gives back to you
You get back short written answers with numbers: event lists with historical win rates, a day-type probability breakdown, a plain description of the bars already printed, max pain levels per expiration, put/call ratios, and estimated dealer gamma exposure. The AI puts these into a normal chat reply, and every response carries a disclaimer that travels with the numbers. Some answers also name a baseline so you can see whether a rate is actually meaningful.
Before you start
What you need
- An AI tool that can connect to an MCP server, like Claude Desktop, Claude Code, Cursor or VS Code
- A free Quant Data key, which the AI can request by email for you (no login or card needed)
- A paid plan if you want more than 10 calls per day
Good to know
It only reports measured history, not advice, and the honest win rates are modest (52 to 56 percent), so treat any single number as a description of the past, not a prediction.
Install it with your AI
Add Quant Data market statistics to your AI, no technical skills needed
You don't install anything by hand. You copy one prompt, paste it into an AI that can work on your computer, and it checks, installs and connects the server for you, asking you when it needs something.
Sign in to get the install prompt
Members get a ready-made prompt that lets the Claude desktop app check Quant Data market statistics, install it and connect it for them, step by step. You don't need any technical skills: you copy, paste and answer a few questions. Your connected AI can also find and install any of the 4,609 MCP servers here for you.
Who it's for
Traders, analysts and finance-minded office workers who follow US stocks, ETFs, futures or Asian markets and want measured statistics rather than opinions.