MCP server · Developer tools
JetBrains Debugger MCP server
by hechtcarmel
Lets your AI set breakpoints, step through code, and inspect variables inside JetBrains IDEs.

This is a plugin for JetBrains IDEs like IntelliJ IDEA, PyCharm, and WebStorm. It gives your AI assistant control over the debugger, so it can pause your code, look at what is happening, and help you find bugs. It is handy if you use an AI coding assistant and want it to actually run and inspect your program instead of just reading the code.
What is an MCP server? The 30-second version
On its own, your AI can only chat and read text. An MCP server is a small helper program that gives your AI a new skill or a connection to an app. This plugin runs a helper inside your JetBrains IDE, and it connects your AI to the debugger in that IDE. So when you ask your AI to debug something, it can actually set breakpoints, run your code, and look at variables for you.
What this MCP server does
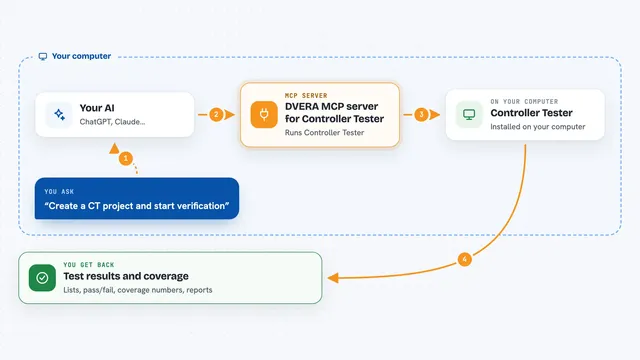
You ask your AI to debug a function or find a bug. The AI uses this helper to talk to your JetBrains IDE. The helper sets breakpoints, starts the debugger, and pauses your program at the right spot. Then it reads the variables, the call stack, and the nearby source code. You get all of that back in your chat as a clear picture of what your code is doing.
 Click to zoom
What you can do with it
- Set breakpoints on any line, including conditional ones
- Start and stop debug sessions for your run configurations
- Step over, into, and out of code line by line
- Inspect local variables, arguments, and object fields
- Change a variable's value while the program is paused
- Evaluate expressions or run small code snippets in the current context
- View the full call stack and switch between stack frames
Try asking your AI
- “Debug the calculateTotal function. Set a breakpoint at line 42, run the tests in debug mode, and show me the variable values when it pauses.”
- “There is a bug in UserService. Set a breakpoint at line 42, run the tests in debug mode, and when it breaks, show me the stack trace and all local variables.”
- “Step through the processOrder method line by line and tell me where the total becomes zero.”
- “Evaluate the expression items.size() at the current breakpoint and tell me the result.”
What it gives back to you
You get answers in your chat: lists of breakpoints, debug session status, variable values, stack traces, and source code around the current line. When the AI changes something, like a variable value or a breakpoint, it tells you what it did. It can also wait until your program pauses and then report everything it sees.
Before you start
What you need
- A JetBrains IDE like IntelliJ IDEA, PyCharm, or WebStorm
- The Debugger MCP Server plugin installed from the JetBrains Marketplace
- An AI assistant that supports MCP, like Claude Code, Codex CLI, Cursor, or Gemini CLI
Good to know
This plugin lets your AI control the debugger and change variable values, so only connect it to projects you trust and review what it does.
Install it with your AI
Add JetBrains Debugger MCP server to your AI, no technical skills needed
You don't install anything by hand. You copy one prompt, paste it into an AI that can work on your computer, and it checks, installs and connects the server for you, asking you when it needs something.
Sign in to get the install prompt
Members get a ready-made prompt that lets the Claude desktop app check JetBrains Debugger MCP server, install it and connect it for them, step by step. You don't need any technical skills: you copy, paste and answer a few questions. Your connected AI can also find and install any of the 4,609 MCP servers here for you.
Who it's for
Developers who use JetBrains IDEs and want their AI assistant to help find and fix bugs by actually running and inspecting the code.