MCP server · Developer tools
x64dbg MCP server
by rison1337
Lets your AI drive a live x64dbg debugging session: set breakpoints, read memory, capture traces, and dump files.
This is a helper that connects your AI assistant to x64dbg or x32dbg, the free Windows debugger used for reverse engineering. It lets the AI start or attach to a program, watch what it does while running, and pull out useful files and notes. It is made for people who already poke at Windows programs and want the boring clicking parts handled by the AI.
What is an MCP server? The 30-second version
On its own, your AI can only chat. An MCP server is a small helper program that gives your AI one new skill, and here that skill is talking to x64dbg. Once it is set up, the AI can ask x64dbg to launch a program, pause it, read its memory, or save a dump, and then tell you what it found. You still make the decisions; the AI just does the button pressing for you.
What this MCP server does
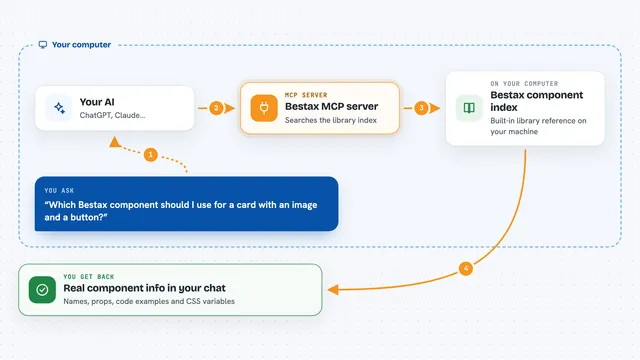
You ask your AI something like "open this program and stop when it reaches the main entry point". The AI passes that request to this helper, which talks to a real x64dbg or x32dbg window on your PC. The debugger runs the program, pauses where you asked, and reports back registers, memory, breakpoints, and traces. The helper then hands the results to your AI, which explains them to you in the chat. It can also save dumps, fix imports, and export evidence for IDA.
What you can do with it
- Launch a program under the debugger or attach to one already running
- Set breakpoints and wait until the program hits them
- Read and change registers, memory, threads, and modules
- Trace instructions, API calls, heap activity, and exceptions
- Search memory for strings, patterns, and the original entry point
- Dump a running program to a PE file or minidump and validate it
- Export runtime facts to IDA using a file hash plus module offset
Try asking your AI
- “Open C:\samples\target.exe under x64dbg and stop at the entry point”
- “Set a breakpoint on CreateFileW and tell me what filename it gets”
- “Scan memory for readable strings and show me the interesting ones”
- “Dump the main module to a file and check that the dump looks valid”
What it gives back to you
You get short answers in the chat: which process was bound, which breakpoint was hit, what the registers or memory contained, or a list of strings and trace entries. When you ask for a dump, it writes a file to disk and tells you where it went and whether it passed validation. Longer evidence can be requested if you want the full detail.
Before you start
What you need
- Windows with x64dbg and x32dbg already installed
- Python 3.11 installed on your PC
- An MCP client such as Claude Desktop, Claude Code, Codex, Cursor, or VS Code
- The x64dbg MCP release ZIP from the project's Releases page
Good to know
This tool can start, pause, and change a running program on your PC, so only use it on files you are allowed to analyze and inside a disposable virtual machine for anything untrusted.
Install it with your AI
Add x64dbg MCP server to your AI, no technical skills needed
You don't install anything by hand. You copy one prompt, paste it into an AI that can work on your computer, and it checks, installs and connects the server for you, asking you when it needs something.
Sign in to get the install prompt
Members get a ready-made prompt that lets the Claude desktop app check x64dbg MCP server, install it and connect it for them, step by step. You don't need any technical skills: you copy, paste and answer a few questions. Your connected AI can also find and install any of the 4,611 MCP servers here for you.
Who it's for
Reverse engineers, malware analysts, and security researchers who already use x64dbg and want their AI assistant to handle the repetitive debugging steps.