
MCP server · Analytics
csvglow MCP server
by Ratnaditya-J
Turn a CSV or Excel file into an interactive HTML dashboard your AI can build for you.
csvglow is a small tool that takes a spreadsheet file and turns it into a single HTML dashboard page with charts and tables. Once you connect it to your AI assistant, you can just point at a file and ask for a dashboard. It is handy for anyone who has data in a CSV or Excel file and wants a quick visual overview without learning chart software.
What is an MCP server? The 30-second version
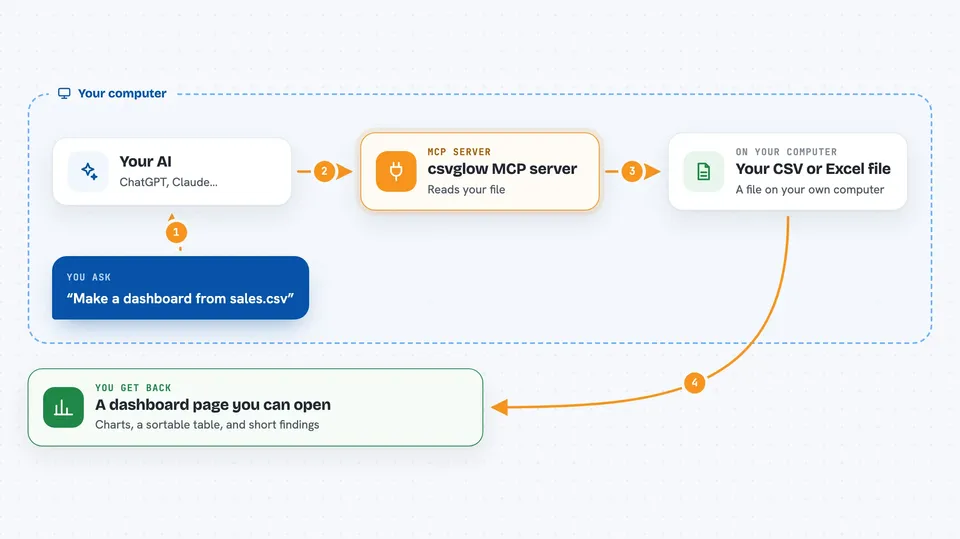
On its own, your AI can only chat with you. An MCP server is a small helper program that gives your AI a new skill or a connection to an app. Here, the helper is csvglow, and the skill is making dashboards from spreadsheet files. When you ask your AI to build a dashboard, it passes the file path to csvglow, and csvglow does the work.
What this MCP server does
You tell your AI which CSV or Excel file you want to look at. The AI passes that file path to csvglow. csvglow reads the file, figures out which columns are numbers, categories, or dates, and builds charts and a sortable table. It saves everything as one HTML file that opens in your browser. You get a finished dashboard page you can scroll through and share.
 Click to zoom
What you can do with it
- Turn a CSV file into an interactive HTML dashboard
- Turn an Excel file into the same kind of dashboard
- Get histograms and summary stats for numeric columns
- Get bar charts for category columns
- See a correlation heatmap between numeric columns
- Get a sortable, filterable table of your rows
- Save the dashboard to a file path you choose
Try asking your AI
- “Make a dashboard from sales.csv”
- “Turn report.xlsx into an HTML dashboard and save it as report.html”
- “Build a dashboard from data.csv but don't open the browser”
- “Create a dashboard from my quarterly numbers spreadsheet”
What it gives back to you
You get a single HTML file that opens in your browser as a dashboard. It shows charts like histograms, bar charts, time series, a correlation heatmap, and scatter plots, plus a sortable table of the first 1000 rows. There is also a short written findings section that points out things like top performers, underperformers, and possible contradictions across columns. In the chat, your AI usually tells you where the file was saved and what it found.
Before you start
What you need
- A CSV, TSV, XLS, or XLSX file on your computer
- Node.js installed if you use the npx option
- Python with pip if you use the pip install option
Good to know
It reads the spreadsheet file you point it at, so only use files you are comfortable sharing with your AI assistant.
Install it with your AI
Add csvglow MCP server to your AI, no technical skills needed
You don't install anything by hand. You copy one prompt, paste it into an AI that can work on your computer, and it checks, installs and connects the server for you, asking you when it needs something.
Sign in to get the install prompt
Members get a ready-made prompt that lets the Claude desktop app check csvglow MCP server, install it and connect it for them, step by step. You don't need any technical skills: you copy, paste and answer a few questions. Your connected AI can also find and install any of the 4,361 MCP servers here for you.
Who it's for
Anyone who works with spreadsheets and wants a quick visual overview, like analysts, marketers, operations folks, and small business owners.


