
MCP server · Analytics
MCP Dashboards
by KyuRish
Your AI can turn plain numbers into interactive charts and dashboards right inside the chat.
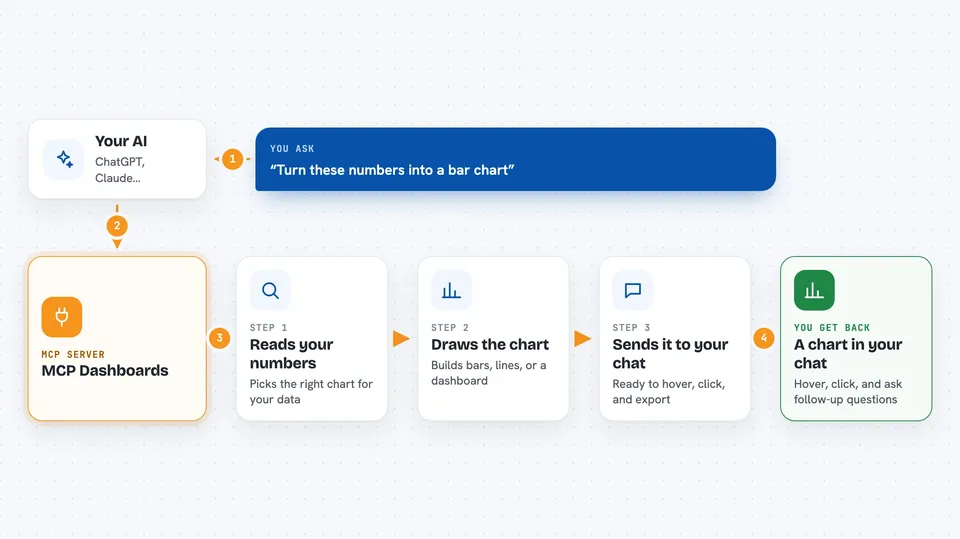
MCP Dashboards is a helper that lets your AI draw real, interactive charts and dashboards for you, right in the conversation. Instead of copying numbers into a spreadsheet and building a chart by hand, you just describe what you want and it appears. It is handy for anyone who works with numbers, reports, or data and wants to see the picture quickly.
What is an MCP server? The 30-second version
On its own, your AI can only chat and write text. An MCP server is a small helper program that gives your AI a new skill or a connection to an app or service. This server gives your AI the skill of drawing charts and dashboards. Once it is connected, you can ask for a chart in plain words and your AI will use this helper to build it for you.
What this MCP server does
You ask your AI for a chart or dashboard in everyday words. Your AI picks the right chart type, formats your data, and asks this helper to draw it. The helper builds an interactive chart and sends it back into your chat. You can then hover over points, click to select, or ask follow-up questions. It can also pull fresh numbers from a web link on a timer so a chart keeps updating.
 Click to zoom
What you can do with it
- Turn a list of numbers into a bar, line, or pie chart
- Build a dashboard with KPI cards and several charts together
- Show money or people flowing between stages as a Sankey diagram
- Put values on a world map by country
- Track a price or metric live, updating every 30 seconds
- Draw a flowchart of a process or pipeline you can click through
- Export a chart as an image, a slide, or a printable page
Try asking your AI
- “Compare Q1 vs Q2 revenue by region as a bar chart”
- “Show my portfolio allocation as a donut chart with the boardroom theme”
- “Build a dashboard with monthly sales KPIs and a trend line”
- “Track Bitcoin price live, updating every 30 seconds”
What it gives back to you
You get an interactive chart or dashboard right inside the chat window. You can hover for details, click a point to ask the AI more about it, and drill into parts of the data. Some charts also come with a link to open the same chart in your browser, and you can export it as a PNG image, a slide, or a printable page.
Before you start
What you need
- The Claude desktop app, VS Code, or another app that supports MCP Apps
- Node.js installed on your computer (the free program that runs the helper)
- An internet connection if you want charts that pull live data from a web link
Good to know
Charts that pull live data can reach out to web addresses you give them, so only point them at sources you trust.
Install it with your AI
Add MCP Dashboards to your AI, no technical skills needed
You don't install anything by hand. You copy one prompt, paste it into an AI that can work on your computer, and it checks, installs and connects the server for you, asking you when it needs something.
Sign in to get the install prompt
Members get a ready-made prompt that lets the Claude desktop app check MCP Dashboards, install it and connect it for them, step by step. You don't need any technical skills: you copy, paste and answer a few questions. Your connected AI can also find and install any of the 4,361 MCP servers here for you.
Who it's for
Anyone who works with numbers, reports, or data and wants charts without building them by hand, like analysts, managers, and office teams.


