MCP server · Analytics
Observability MCP server
Ask your AI about your Grafana, Prometheus, Kafka and Datadog setup and get answers in plain chat.
This is a small helper that lets your AI assistant look inside your monitoring tools: Grafana, Prometheus, Kafka UI and Datadog. It runs on your own computer and uses your own login details, so nothing is sent to a stranger's server. It is handy if you keep an eye on dashboards, alerts or system health at work.
What is an MCP server? The 30-second version
On its own, your AI can only chat with you. An MCP server is a small helper program that gives your AI a new skill or a connection to another app. This one connects your AI to your monitoring tools, so it can look up dashboards, alerts, metrics and Kafka topics for you. You just ask in normal words, and the helper does the fetching.
What this MCP server does
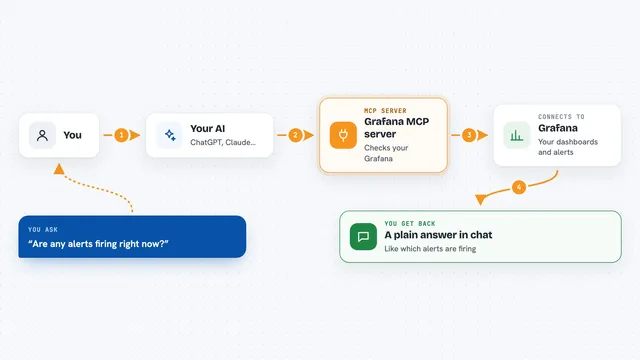
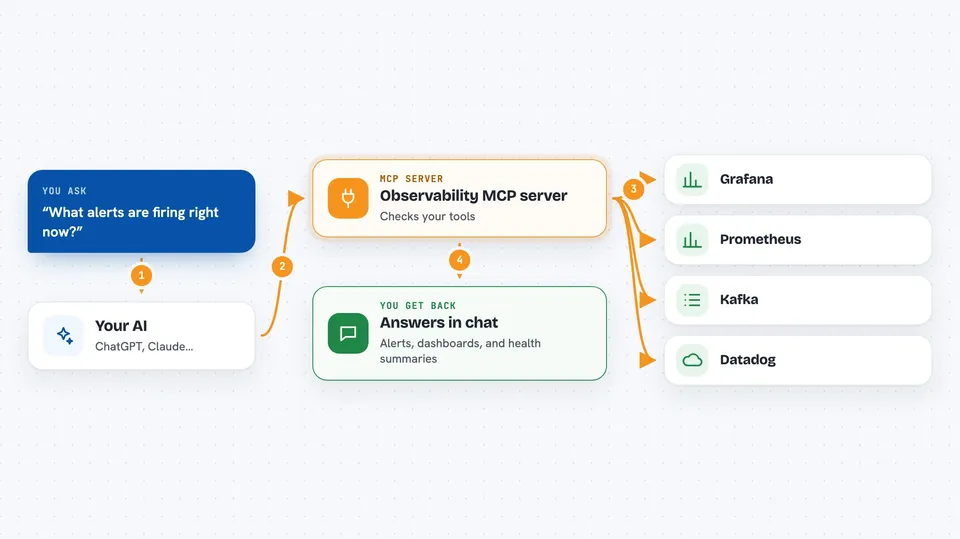
You ask your AI something like what alerts are firing right now. The AI passes that question to this helper program running quietly on your machine. The helper talks to your Grafana, Prometheus, Kafka UI or Datadog using the web addresses and passwords you gave it. It brings the answer back and your AI writes it out for you in the chat. You never have to open four different websites to check things.
 Click to zoom
What you can do with it
- Check whether all your monitoring backends are reachable
- List active alerts and alert rules in Grafana
- Run a metric query in Prometheus and see the current value or a range over time
- List Kafka topics, consumer groups and how far behind they are
- Look up Datadog monitors, dashboards and services
- Search Grafana dashboards by name or tag
- Send a scheduled health report to a Slack channel
Try asking your AI
- “What observability tools do you have available?”
- “Are any Grafana alerts firing right now?”
- “Show me the current value of the http_requests_total metric in Prometheus”
- “Which Kafka consumer groups have a lag over 1000?”
What it gives back to you
You get answers written in the chat: tables of alerts, lists of dashboards or topics, numbers from a metric query, or a short summary of what is healthy and what is not. For Datadog, you get information about monitors, services and dashboards. If you set up scheduled reports, a formatted message also lands in your Slack channel.
Before you start
What you need
- The Claude Code or Codex CLI app on your computer
- Node.js installed (the helper runs through npx)
- Web addresses and login details for the tools you want to connect, like a Grafana token or a Datadog API key
- A Slack webhook URL only if you want scheduled reports
Good to know
Your login details sit in a config file on your machine, so keep that file out of shared code folders and never commit it to git.
Install it with your AI
Add Observability MCP server to your AI, no technical skills needed
You don't install anything by hand. You copy one prompt, paste it into an AI that can work on your computer, and it checks, installs and connects the server for you, asking you when it needs something.
Sign in to get the install prompt
Members get a ready-made prompt that lets the Claude desktop app check Observability MCP server, install it and connect it for them, step by step. You don't need any technical skills: you copy, paste and answer a few questions. Your connected AI can also find and install any of the 4,609 MCP servers here for you.
Who it's for
People who watch systems at work, like developers, site reliability engineers, DevOps folks and anyone who checks dashboards and alerts.