MCP server · Analytics · official
Grafana MCP server
by grafana · official
Lets your AI search dashboards, check alerts, and query your Grafana data for you.
This is a helper that connects your AI assistant to Grafana, the tool many teams use to watch their systems and see charts of what is happening. Once it is set up, you can just ask your AI questions in plain words instead of clicking around Grafana yourself. It is handy for anyone who checks dashboards, alerts, or logs as part of their job.
What is an MCP server? The 30-second version
On its own, your AI can only chat with you. An MCP server is a small helper program that gives your AI a new skill or a connection to an app. This one connects your AI to your Grafana instance, so it can look things up and answer questions about your dashboards, alerts, and data. You ask in normal words, and the helper does the clicking behind the scenes.
What this MCP server does
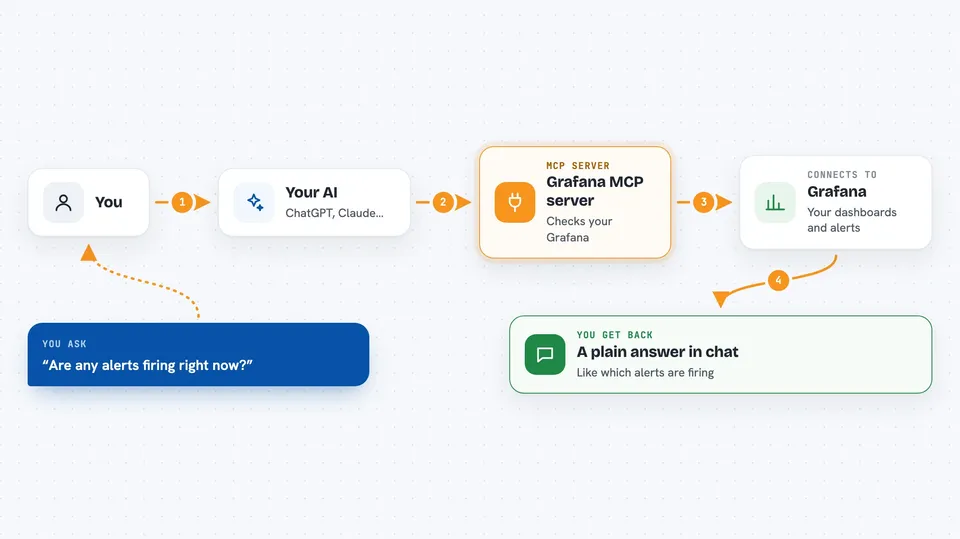
You ask your AI something about your Grafana setup, like which dashboards exist or whether an alert is firing. The AI passes your request to this helper program. The helper talks to your Grafana instance using a special access token you set up. Grafana sends back the matching dashboards, alert statuses, or data. Your AI then turns that into a plain answer in the chat.
 Click to zoom
What you can do with it
- Search for dashboards by name, folder, or tag
- Check which alert rules are firing or normal
- Look up details of a specific dashboard
- Query data from sources like Prometheus or Loki
- Search, create, and update incidents
- List Sift investigations and find error patterns in logs
- Ask the Grafana Assistant a question
Try asking your AI
- “Which dashboards do we have about payments?”
- “Are any alerts firing right now?”
- “Show me the error rate for the checkout service over the last hour”
- “List the open incidents and what happened in each”
What it gives back to you
You get answers in the chat, like a list of dashboard names, a summary of an alert's status, or numbers from a query. It can also show details such as panel titles and the data source behind them. If you ask it to change something, like creating an incident, it tells you what it did.
Before you start
What you need
- A Grafana account, either your own server or Grafana Cloud
- Grafana version 9.0 or newer for full features
- A service account token from Grafana (a kind of password the app gives you)
- The uv tool installed, or Docker if you prefer that route
Good to know
It can change things in Grafana, like dashboards and incidents, and it can read your monitoring data, so only connect it with a token that has the access you are comfortable giving.
Install it with your AI
Add Grafana MCP server to your AI, no technical skills needed
You don't install anything by hand. You copy one prompt, paste it into an AI that can work on your computer, and it checks, installs and connects the server for you, asking you when it needs something.
Sign in to get the install prompt
Members get a ready-made prompt that lets the Claude desktop app check Grafana MCP server, install it and connect it for them, step by step. You don't need any technical skills: you copy, paste and answer a few questions. Your connected AI can also find and install any of the 4,361 MCP servers here for you.
Who it's for
People who monitor systems, like engineers, on-call staff, and anyone who checks dashboards or alerts regularly.