MCP server · Developer tools
Perfetto trace analysis MCP server
by tooluse-labs
Lets your AI open a Perfetto trace file and answer questions about app and browser performance in plain words.

This is a small helper that connects your AI assistant to Perfetto, a free tool for looking at performance recordings (called traces) of apps and web pages. Once it is set up, you can point your AI at a trace file and just ask questions about it. It is handy for anyone who has a trace file and does not want to learn the query language behind it.
What is an MCP server? The 30-second version
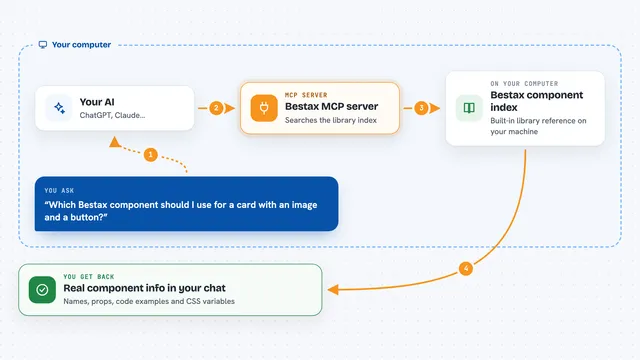
On its own, your AI can only chat and write text. An MCP server is a small helper program that gives your AI a new skill or a connection to another tool. This one connects your AI to Perfetto, so it can open a trace file and run the analysis for you. You ask in normal words, and the helper does the technical work behind the scenes.
What this MCP server does
You tell your AI which trace file to open, and it uses this helper to load it. The helper then reads the file and figures out what kind of trace it is, for example a Chrome browser trace or an Android trace. For common questions, it uses ready-made recipes, so your AI does not have to write any query by hand. For anything unusual, your AI can write its own query and run it on the same file. You get the answer back in the chat, usually as a short list or summary.
 Click to zoom
What you can do with it
- Open a Perfetto trace file and see a short overview of it
- Find the worst scroll jank frames and what caused them
- Summarize page loads with timings like FCP, LCP and load time
- List the slowest main-thread tasks in a trace
- Break down a long task into its smaller child steps
- List processes and threads inside a trace
- Run your own custom query when the ready-made ones are not enough
Try asking your AI
- “Load ~/traces/scroll_jank.pftrace and tell me the top scroll-jank causes”
- “Which page loads in this trace were the slowest, and what were their FCP and LCP times?”
- “Show me the top main-thread hotspots in this trace”
- “List the processes and threads in this trace file”
What it gives back to you
You get answers in the chat, usually as short lists or summaries. For example, a list of janky frames with their cause, or a table of page loads with their timings in milliseconds. When you run a custom query, you get the rows back, up to a limit. Sensitive values like URLs and cookies are hidden by default.
Before you start
What you need
- An MCP client such as Claude Code, Claude Desktop, Codex or Cursor
- A Perfetto trace file you want to analyze
- An internet connection the first time, so the helper can download the Perfetto engine it needs
Good to know
Trace files can contain private URLs, headers, cookies and local file paths, and these are sent to your AI as part of the answer, though sensitive values are hidden by default.
Install it with your AI
Add Perfetto trace analysis MCP server to your AI, no technical skills needed
You don't install anything by hand. You copy one prompt, paste it into an AI that can work on your computer, and it checks, installs and connects the server for you, asking you when it needs something.
Sign in to get the install prompt
Members get a ready-made prompt that lets the Claude desktop app check Perfetto trace analysis MCP server, install it and connect it for them, step by step. You don't need any technical skills: you copy, paste and answer a few questions. Your connected AI can also find and install any of the 4,609 MCP servers here for you.
Who it's for
Web and app developers, performance engineers, and anyone who has a Perfetto trace and wants quick answers without writing queries.