MCP server · Developer tools
OpenTelemetry MCP server
by traceloop
Lets your AI look through your app's trace data to find errors, slow calls, and token costs.
This is a helper that connects your AI assistant to your OpenTelemetry trace data. Traces are the records your apps leave behind about what they did and how long it took. If your team collects these records in a tool like Jaeger, Grafana Tempo, or Traceloop, this server lets you ask your AI questions about them in plain English.
What is an MCP server? The 30-second version
On its own, your AI can only chat with you. An MCP server is a small helper program that gives your AI a new skill or a connection to another app. This one connects your AI to your OpenTelemetry trace backend, so it can look up traces, errors, and usage numbers for you. You ask a question, and the AI uses this helper to go fetch the answer from your trace data.
What this MCP server does
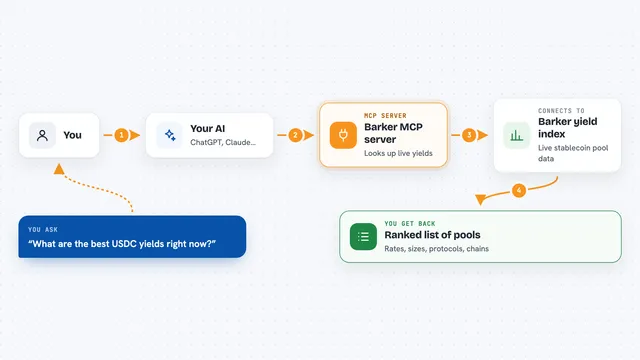
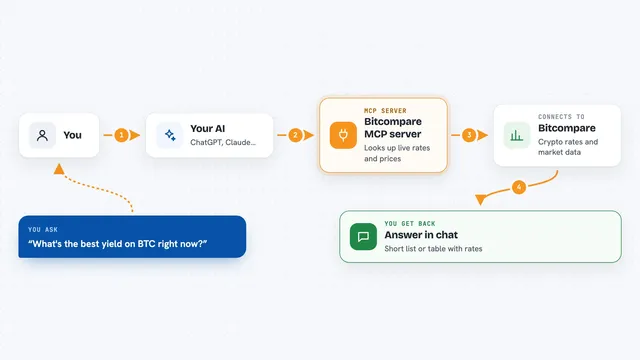
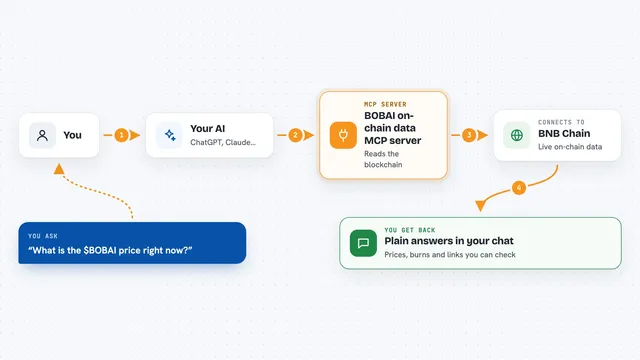
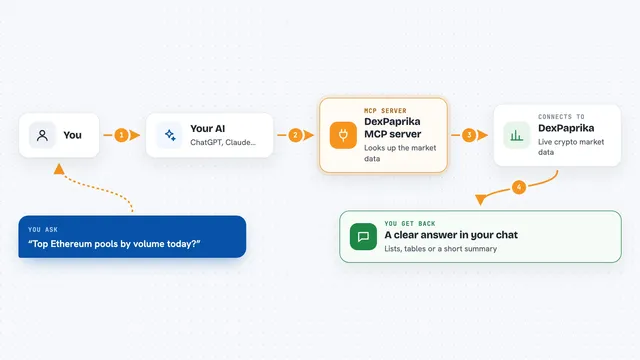
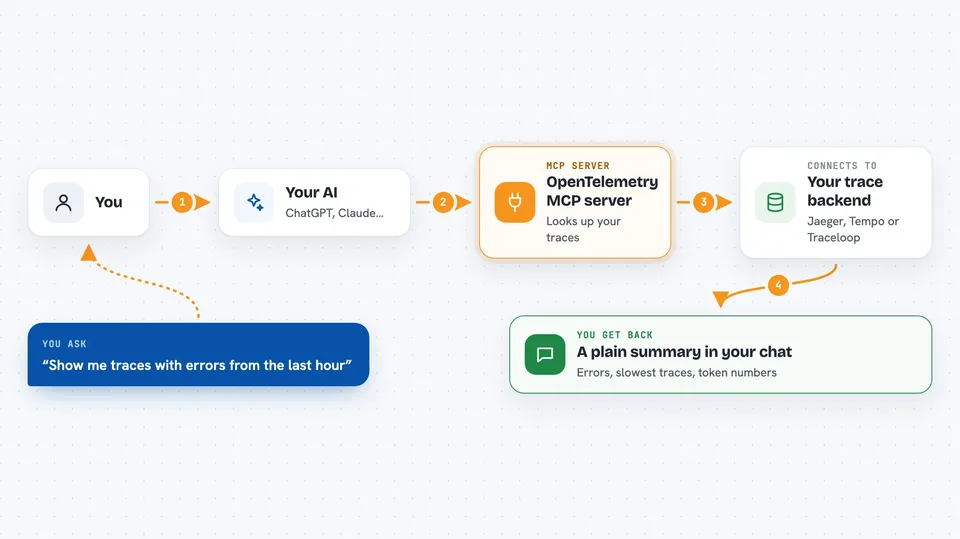
You ask your AI something like which requests failed in the last hour. The AI passes that request to this helper program. The helper then talks to your trace backend, such as Jaeger, Tempo, or Traceloop. It pulls back the matching traces, errors, or token numbers. Then the AI explains what it found in the chat, in normal words.
 Click to zoom
What you can do with it
- Find traces that ended in an error
- Search traces by service, time, or other filters
- Look up the full details of one specific trace
- See how many tokens your AI models are using
- Find the most expensive traces by token count
- Find the slowest operations in your app
- List which services and models are being tracked
Try asking your AI
- “Show me traces with errors from the last hour”
- “Which service is using the most tokens today”
- “Find the slowest requests in the last 24 hours”
- “Compare token usage between gpt-4 and claude requests this week”
What it gives back to you
You get answers written in the chat, like a short summary of the errors found or a list of the slowest traces. For token questions, you get numbers grouped by model or service. For a single trace, you get the full breakdown of what happened step by step. It does not change anything in your backend, it only reads.
Before you start
What you need
- Python 3.11 or higher
- pipx or uv installed (small tools that run Python programs for you)
- The web address of your trace backend, such as http://localhost:16686 for Jaeger
- An API key if you use Traceloop (a kind of password the Traceloop site gives you)
Good to know
It only reads your trace data, so it will not change or delete anything, but the data it reads may include private details about your app and your users.
Install it with your AI
Add OpenTelemetry MCP server to your AI, no technical skills needed
You don't install anything by hand. You copy one prompt, paste it into an AI that can work on your computer, and it checks, installs and connects the server for you, asking you when it needs something.
Sign in to get the install prompt
Members get a ready-made prompt that lets the Claude desktop app check OpenTelemetry MCP server, install it and connect it for them, step by step. You don't need any technical skills: you copy, paste and answer a few questions. Your connected AI can also find and install any of the 4,609 MCP servers here for you.
Who it's for
Developers and support engineers who already collect trace data and want to ask questions about it without learning a query language.