MCP server · Analytics · official
Vizro dashboard builder
by mckinsey · official
Turn your spreadsheet data into working chart and dashboard code just by describing what you want.

This is a small helper created by McKinsey's team behind Vizro, a Python toolkit for building charts and dashboards. Once you set it up next to your AI assistant, you can describe the picture you want and let the AI produce ready-to-run code plus sample datasets. It suits anyone who has data sitting in spreadsheets or CSV files and wants nice visuals without learning a whole coding framework.
What is an MCP server? The 30-second version
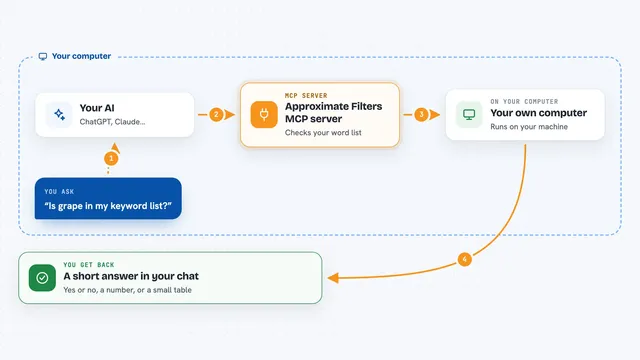
On its own, your AI can only talk. An MCP server is a little companion program running quietly beside it that hands your AI extra skills. This particular one connects your AI to Vizro, a library for drawing charts and assembling simple interactive dashboards. So instead of guessing at syntax, your AI asks Vizro what components exist and gets correct snippets straight from the source.
What this MCP server does
When you request a visualisation, the AI calls on this helper rather than writing everything blind. The helper shares Vizro's actual building blocks, along with starter examples showing valid ways to combine cards, figures and controls. Your AI then assembles that into finished Python code matching your chosen design style, whether dark mode or something else. If you don't supply data yourself, it generates plausible dummy tables so the result runs immediately. Everything stays on your computer, since the helper merely serves reference material locally.
 Click to zoom
What you can do with it
- Generate complete Vizro dashboard scripts based on a written brief
- Get accurate component details so the produced code actually executes
- Produce stand-in test data automatically whenever yours isn't provided yet
- Pick among preset appearance choices such as light or dark styling
- Follow guided workflow stages covering planning through validation
- Explore official illustration projects bundled inside the package
Try asking your AI
- “Build me a sales overview board tracking revenue across regions month by month”
- “Show customer satisfaction survey responses broken down per department”
- “Create a comparison view contrasting product returns against total shipments”
- “Make a compact monitoring screen summarising weekly website visitor counts”
What it gives back to you
In return you receive readable Python script forming a functioning Vizro project, together with whatever fabricated dataset was required to demonstrate it. Occasionally supporting notes accompany the answer clarifying why certain elements were picked. Nothing arrives pre-rendered visually within conversation though, meaning execution happens afterwards wherever appropriate software exists.
Before you start
What you need
- Either uv or Docker installed beforehand depending upon preferred route
- Permission added allowing whichever AI client hosts connections toward external helpers
- Local storage location holding desired spreadsheet documents reachable during operation
Install it with your AI
Add Vizro dashboard builder to your AI, no technical skills needed
You don't install anything by hand. You copy one prompt, paste it into an AI that can work on your computer, and it checks, installs and connects the server for you, asking you when it needs something.
Sign in to get the install prompt
Members get a ready-made prompt that lets the Claude desktop app check Vizro dashboard builder, install it and connect it for them, step by step. You don't need any technical skills: you copy, paste and answer a few questions. Your connected AI can also find and install any of the 4,361 MCP servers here for you.
Who it's for
Analysts, reporting specialists and anybody regularly converting raw business measurements into presentation-ready graphics would benefit greatly here.