MCP server · Analytics
Datadog MCP server
by us-all
Ask your AI about your Datadog monitors, logs, incidents and SLOs, and get clear answers back.

This is a helper that connects your AI assistant to Datadog, the tool many teams use to watch their websites and apps. Once it is set up, you can ask your AI plain questions about what is happening in Datadog instead of clicking around the dashboard yourself. It is handy for anyone who gets pulled into incidents or has to check on system health.
What is an MCP server? The 30-second version
On its own, your AI can only chat with you. An MCP server is a small helper program that gives your AI a new skill, in this case the ability to talk to Datadog. You install this helper on your own computer, give it your Datadog keys, and from then on your AI can look things up in Datadog for you when you ask. You stay in the chat, and the helper does the running around.
What this MCP server does
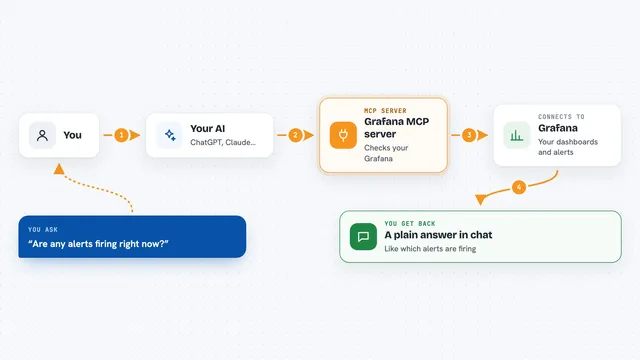
You ask your AI something like which monitors are noisy this week. The AI sends that request to this helper program running on your machine. The helper talks to Datadog using your API and application keys, gathers the data, and hands it back to the AI. The AI then explains it to you in the chat, often as a short list or summary. For changes like creating a monitor or an SLO, the helper can also make the change in Datadog, but only if you turn writes on.
 Click to zoom
What you can do with it
- List your monitors and see which ones are alerting too often
- Check how much error budget your SLOs have left this month
- Pull recent logs and error spikes for a service during an incident
- Look up which deployments touched a service in the last day
- See RUM error groups and the user actions before the errors
- Create or update an SLO when you allow writes
- Schedule an agent rollout to a cluster with fleet automation
Try asking your AI
- “List my SLOs and their error budget remaining this month, grouped by compliant, at-risk and breached”
- “There is an active incident on checkout-service. Pull the linked monitors, recent APM error spikes, and which deployments touched it in the last 24 hours”
- “Find monitors that alerted more than 10 times in the last 7 days but had a very short recovery time”
- “RUM error rate jumped on the checkout funnel between 14:00 and 14:30 today. Show me the top error groups and affected sessions”
What it gives back to you
You get answers in the chat, usually as short lists, tables or summaries. For example, a list of monitor names with their alert counts, or a breakdown of SLOs by status. If you ask for a change and writes are enabled, it tells you what it created, updated or deleted. Some tools also return a visual card on ChatGPT clients, while Claude shows the same information as text.
Before you start
What you need
- A Datadog account with access to the data you want to look at
- A Datadog API key and Application key (these are like passwords for apps, you create them in your Datadog account settings)
- Node.js 22 or newer, or Docker if you prefer that route
- The Claude desktop app or Claude Code, or another AI client that supports MCP servers
Good to know
By default it can only read, but if you turn on writes it can create, change or delete monitors, dashboards, SLOs and more in your real Datadog account.
Install it with your AI
Add Datadog MCP server to your AI, no technical skills needed
You don't install anything by hand. You copy one prompt, paste it into an AI that can work on your computer, and it checks, installs and connects the server for you, asking you when it needs something.
Sign in to get the install prompt
Members get a ready-made prompt that lets the Claude desktop app check Datadog MCP server, install it and connect it for them, step by step. You don't need any technical skills: you copy, paste and answer a few questions. Your connected AI can also find and install any of the 4,361 MCP servers here for you.
Who it's for
Engineers, on-call staff, SREs and anyone who uses Datadog daily and wants quick answers without clicking through dashboards.