MCP server · Analytics
Prometheus MCP server
by pab1it0
Ask your AI about your Prometheus monitoring numbers in plain English, and get the real values back.

This is a small helper that connects your AI assistant to Prometheus, the tool many IT teams use to keep an eye on servers and apps. Once it is connected, you can ask questions about your monitoring numbers in normal words, instead of writing the special query language yourself. It is handy for anyone who needs a quick answer from monitoring data but does not work with it all day.
What is an MCP server? The 30-second version
On its own, your AI can only chat with you. It cannot see your systems or your monitoring data. An MCP server is a small helper program you attach to your AI, and it gives the AI one new skill or one new connection. This one connects your AI to your Prometheus server, so the AI can look things up there and bring the answers back to you when you ask.
What this MCP server does
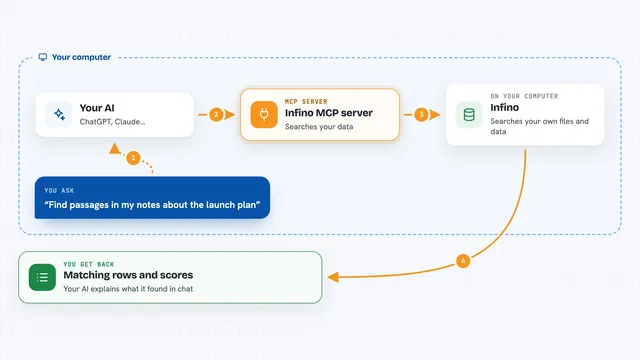
You ask your AI a question about your monitoring numbers. The AI hands that question to this helper program. The helper turns it into the query language Prometheus understands, sends it to your Prometheus server, and waits for the reply. When the answer comes back, your AI explains it in plain words in the chat, along with the actual numbers. You never have to touch the query language yourself.
 Click to zoom
What you can do with it
- Look up the current value of a metric
- List which metrics exist in your Prometheus setup
- Read what a metric means from its description
- Check which targets Prometheus is watching right now
- Get numbers over a time window, such as the last 24 hours
- Check whether the monitoring server itself is alive
Try asking your AI
- “Which metrics do we have about disk usage?”
- “What was the average CPU usage on our servers over the last 24 hours?”
- “Is our Prometheus server healthy right now?”
- “Which targets are down at the moment?”
What it gives back to you
You get answers in the chat, not on a separate dashboard. Depending on what you asked, that can be a single number, a short list of metric names, a table of values over time, or a plain sentence explaining what the numbers mean. Query results also come with links to the matching Prometheus page, unless your team turned those links off to save space.
Before you start
What you need
- A Prometheus server that your team already runs, plus its web address (something like http://your-prometheus:9090)
- Docker installed on the computer where your AI app runs
- A username and password, or an access token, if your Prometheus server asks for one
Good to know
This helper only reads your monitoring data, so nothing in Prometheus gets changed, but the settings file can hold your Prometheus password or token, so keep that file private.
Install it with your AI
Add Prometheus MCP server to your AI, no technical skills needed
You don't install anything by hand. You copy one prompt, paste it into an AI that can work on your computer, and it checks, installs and connects the server for you, asking you when it needs something.
Sign in to get the install prompt
Members get a ready-made prompt that lets the Claude desktop app check Prometheus MCP server, install it and connect it for them, step by step. You don't need any technical skills: you copy, paste and answer a few questions. Your connected AI can also find and install any of the 4,609 MCP servers here for you.
Who it's for
Teams that already watch their systems with Prometheus, especially support, operations and IT people who want a quick answer without learning the query language.