MCP server · Analytics
Datadog MCP server
by TANTIOPE
Lets your AI look up Datadog logs, traces, metrics, monitors and incidents for you in plain chat.

This is a small helper that connects your AI assistant to Datadog, the tool many teams use to watch their apps and servers. Once it is set up, you can ask your AI questions about your logs, alerts, dashboards and performance, and it will go fetch the answers from Datadog for you. It is handy for anyone who works with a system that runs on Datadog but does not want to click around the Datadog website all day.
What is an MCP server? The 30-second version
On its own, your AI can only chat with you using what it already knows. An MCP server is a small helper program that gives your AI a new skill or a connection to another service. This one connects your AI to Datadog, so when you ask about an alert, a log line or a slow request, the AI can actually go look it up in your Datadog account. You stay in the chat, and the helper does the running around.
What this MCP server does
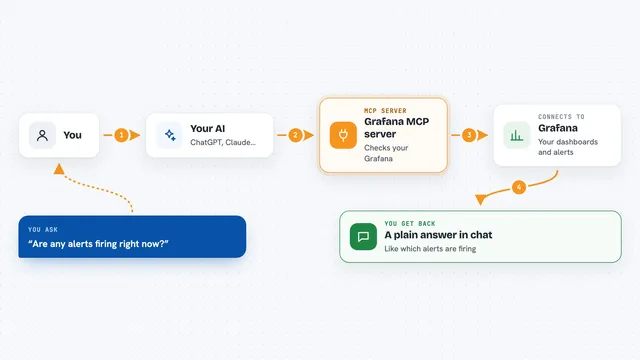
You ask your AI something like "show me errors from the checkout service in the last hour". The AI passes that request to this helper. The helper talks to Datadog using your account keys and pulls back the matching logs, traces, metrics or monitor details. Then the AI reads that data and explains it to you in the chat, often as a short list or summary. You never have to open the Datadog website unless you want to.
 Click to zoom
What you can do with it
- Search logs with a grep-like query and see matching lines
- Filter traces by duration, status or errors to find slow or broken requests
- Query metrics and see timeseries numbers for a time window
- List monitors and check which ones are alerting
- Look up incidents and see what is open right now
- Check SLOs and see how a service is doing against its target
- List hosts and see totals across your infrastructure
Try asking your AI
- “Show me error logs from the payments service in the last 2 hours”
- “Which monitors are currently alerting and what are they about”
- “Find traces slower than 2 seconds on the checkout endpoint today”
- “List open incidents and give me a one line summary of each”
What it gives back to you
You get answers in the chat: lists of log lines, monitor names, incident titles, numbers from metrics, or short summaries the AI writes from the raw data. For example, it might reply with the top five slowest endpoints and their average response times. If you ask it to change something, like creating a monitor or a downtime, it will do that in Datadog and tell you what it did.
Before you start
What you need
- A Datadog account with access to the data you want to look at
- A Datadog API key (a kind of password your Datadog account gives you)
- A Datadog Application key (a second password, also from your Datadog account)
- Node.js installed on your computer if you run it the simple way
Good to know
It can change things in your Datadog account, like creating or deleting monitors, dashboards, incidents and tests, so be careful with requests that write or delete, and use the read-only flag if you only want to look.
Install it with your AI
Add Datadog MCP server to your AI, no technical skills needed
You don't install anything by hand. You copy one prompt, paste it into an AI that can work on your computer, and it checks, installs and connects the server for you, asking you when it needs something.
Sign in to get the install prompt
Members get a ready-made prompt that lets the Claude desktop app check Datadog MCP server, install it and connect it for them, step by step. You don't need any technical skills: you copy, paste and answer a few questions. Your connected AI can also find and install any of the 4,609 MCP servers here for you.
Who it's for
Developers, on-call engineers, SREs and support folks who already use Datadog and want to ask questions in plain chat instead of clicking through the Datadog website.